- Recent efforts by some emerging market (EM) countries to diversify their currency reserves away from the US dollar have raised questions about the beginning of the end of USD dominance. However, the dynamics affecting the US dollar’s role as reserve currency are far more intricate than official statistics suggest and any material decline in the role of the US dollar in global finance will take much longer than current headline news on de-dollarization insinuate.
- The private sector’s use of the US dollar for trade and investment rather than the portfolio allocation choice of central banks will shape the currency’s status. The role of the USD in private sector transactions has remained virtually unchanged, with only slight adjustments based on FX turnover, bond issuance by non-financial corporates and SWIFT payments. In addition, reserves are predominantly invested in safe and liquid assets, but the non-US dollar investment universe remains too small and fragmented to absorb reserves demand, especially in those EM countries that have been most critical of their US dollar dependence.
- Over the long term, the incipient fragmentation of global trade and more diversified oil demand – if persistent – are bound to strengthen the case for USD alternatives. The Gulf countries, which play a crucial role in supporting the USD (e.g. via oil prices and large USD reserves to maintain the peg), are increasingly looking towards China due to the structural changes in the oil market. Similarly, slowing globalization, driven by events like the Covid-19 pandemic and the war in Ukraine, has prompted – among other things – some countries to use non-USD currencies for bilateral trade, which will chip away at the share of USD in total reserves globally – but any significant change will take a long time.
What to watch:
- Airlines – I feel the need, the need for speed – The thirst for travel despite rising airfares as well as declining jet-fuel prices are speeding up the recovery for airlines
- US housing market update – US housing construction activity is in a modest recovery mode and prices are picking up again
- PMI downward momentum – Recent sentiment indicators reveal that economic activity in France and Germany has cooled noticeably
- Corporate debt maturity profiles in Europe and the US – Higher interest rates will increase corporate borrowing costs further until the end of next year
In focus – De-dollarization of FX reserves? Not so fast…
Airlines – I feel the need, the need for speed
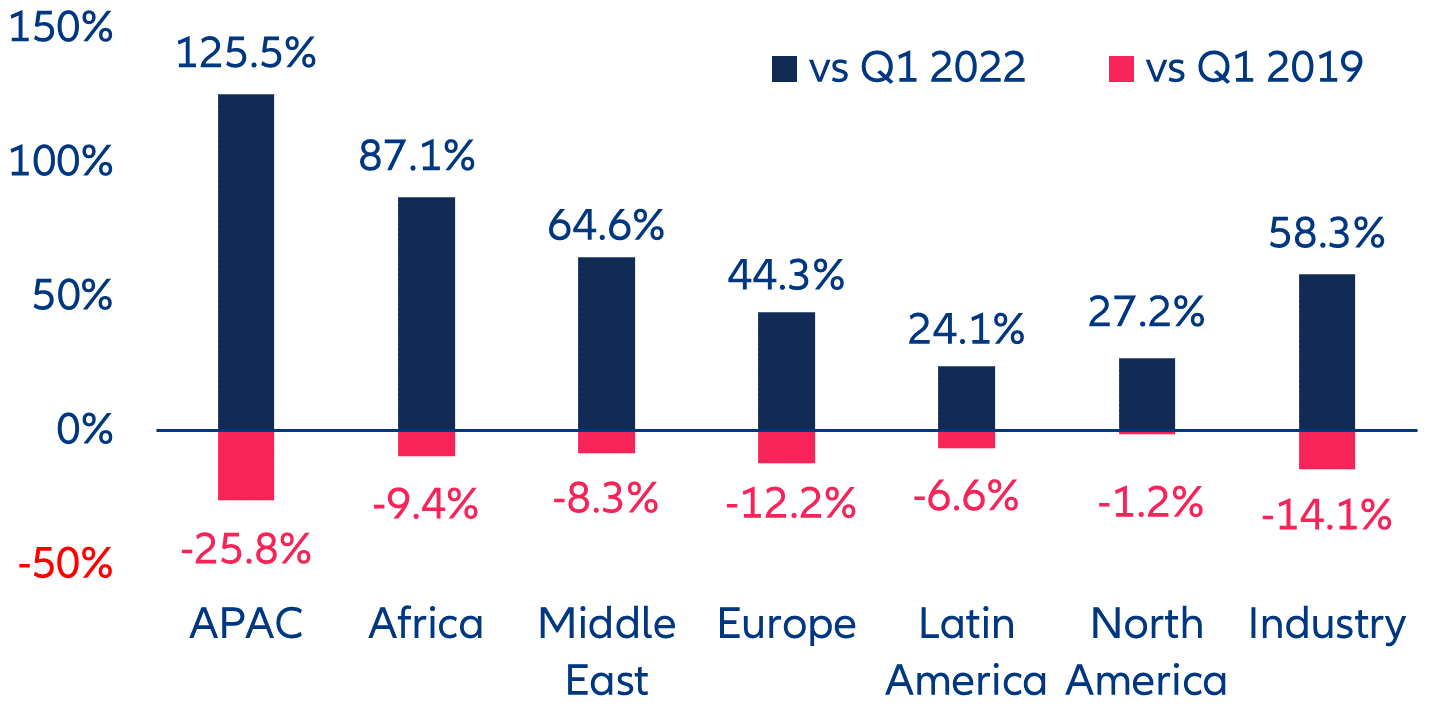
Despite inflation, demand for air travel is taking off. In Q1 2023, global revenue passenger kilometres (RPKs) increased by +58.3% y/y, reaching 85.9% of pre-pandemic levels (Figure 1). The increase was particularly large in Asia (+125.5% y/y) in the wake of China’s reopening. Global sales of airline tickets this summer (May-September 2023) also jumped by +35.2% y/y, reaching 92% of pre-pandemic levels (2019), with demand in North America already at 99%. For the full year 2023, around 4.3bn people are expected to travel (vs 4.5bn in 2019).
Figure 1: Evolution of RPKs by region (% change observed in Q1 2023)
Sources: IATA, Allianz Research
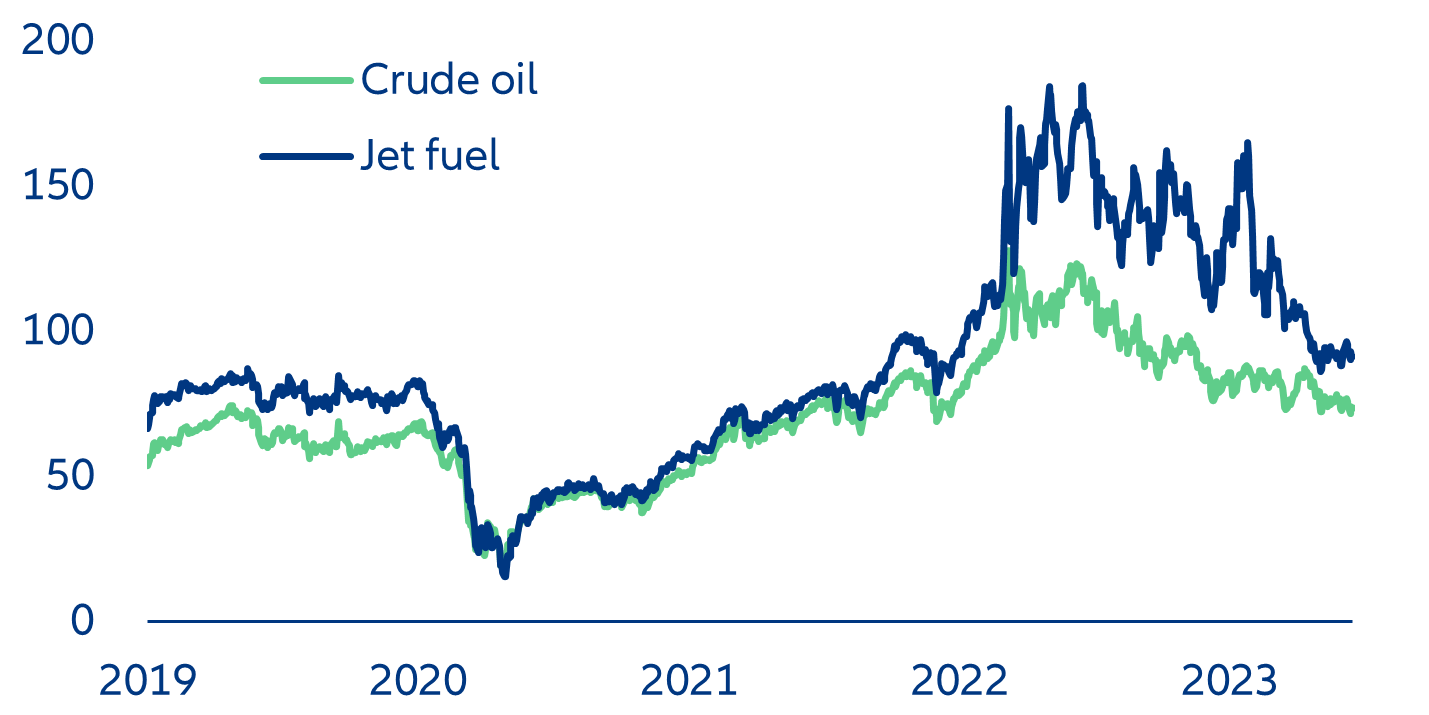
Airlines’ margins are benefiting from rising airfares and declining operating expenses. Even though jet-fuel prices, which represent 30% of sales, remain above the pre-pandemic level, they declined by -36% to USD91.3/bbl this year, about half of the crisis peak of USD184.8/bbl in June 2022. At the same time, airfares have increased, especially for international routes such as those between the US and Europe (+23% YTD on average, Figure 2).
After three loss-making years, the airline industry may break even in 2023 – earlier than expected. According to the International Air Transport Association (IATA), total revenue is expected to rise +9.7% y/y to USD803bn (vs USD838bn in 2019), and net profits could to jump up to USD9.8bn this year (vs USD26.4bn in 2019), with North American carriers recording the strongest results.
Figure 2: Price evolution of crude oil (Brent) and jet fuel (JP-54), USD/barrel
Sources: Bloomberg, Allianz Research.
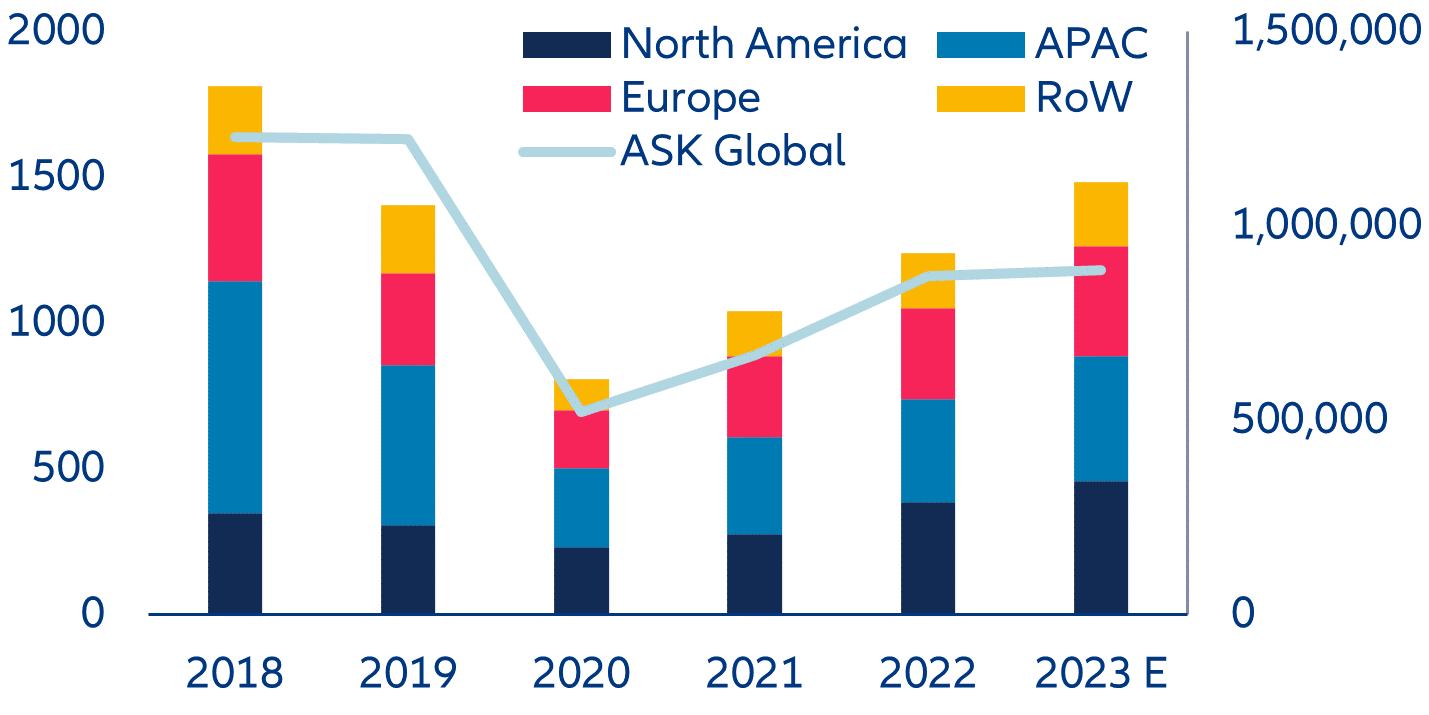
However, limited capacity is holding back airlines’ full revenue potential (Figure 3). In 2018-2019, the sector saw around 1,600 annual aircraft deliveries globally. With a shortage of parts disrupting production, deliveries fell by half in 2020 and began to improve progressively afterwards. In 2022, aircraft deliveries grew by +19.1% y/y and worldwide available seat kilometres (ASK) increased by +39.6% y/y. Yet, original equipment manufacturers continue to struggle to cope with pending demand. For 2023, deliveries are expected to grow by +19.8%, but the current six-month delay does not seem to match plane-makers’ optimistic plans. This supply constraint could justify to keep airfares high.
Figure 3: Aircraft deliveries per year (columns, left axis) and average ASK (line, right axis)
Sources: IATA, Bloomberg, Allianz Research
US housing market – bottomed-out?
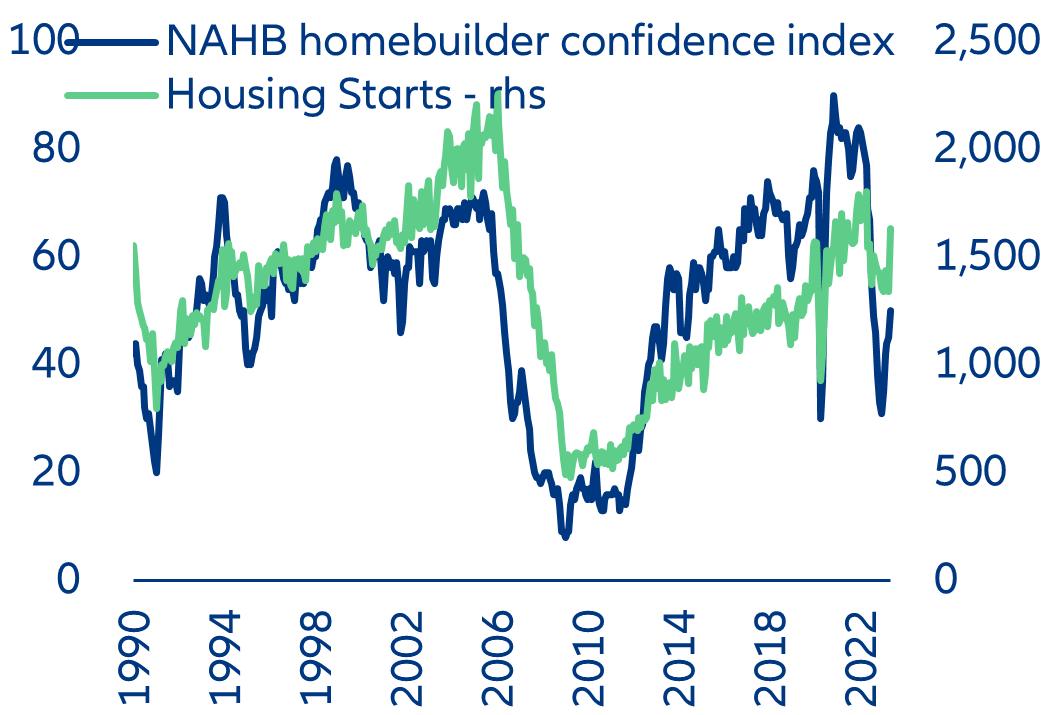
The US housing market has been in a downturn over the last two years but it seems to have reached its end. The Federal Reserve’s hiking cycle pushed benchmark mortgage rates above 6% since end-2022. Elevated borrowing costs together with still-high property prices have deterred US households from purchasing existing homes or building new ones. According to the national accounts, private residential investment slumped more than -20% between Q1 2021 and Q1 2023. However, private housing starts jumped in May as homebuilder confidence is rapidly improving (Figure 4, left). Furthermore, the prior decline in housing activity is likely overstated by the national accounts because of measurement difficulties. More generally, several structural and pandemic-related factors are keeping the US housing market tight in this cycle: (1) strong aggregate household balance sheets, with large liquid assets and a high net-worth-to-income ratio; (2) the recovery in immigration; (3) relatively low housing supply as indicated by low homeowner vacancy rate and (4) the resorption of supply shortages, which is leading to a pick-up in completions as large backlogs are being cleared (Figure 4, right).[2]
We expect residential investment to increase by +1% from Q1 2023 to Q4 2023, and +4.3% in 2024. The very large amount of construction backlogs to be cleared presents some upside risks to our forecasts. However, prolonged tight monetary policy until at least next year should keep the housing recovery sluggish amid persistently high mortgage rates and tight credit conditions.
Figure 4: Housing starts & homebuilder confidence (top); building permits issued but construction not started (bottom)
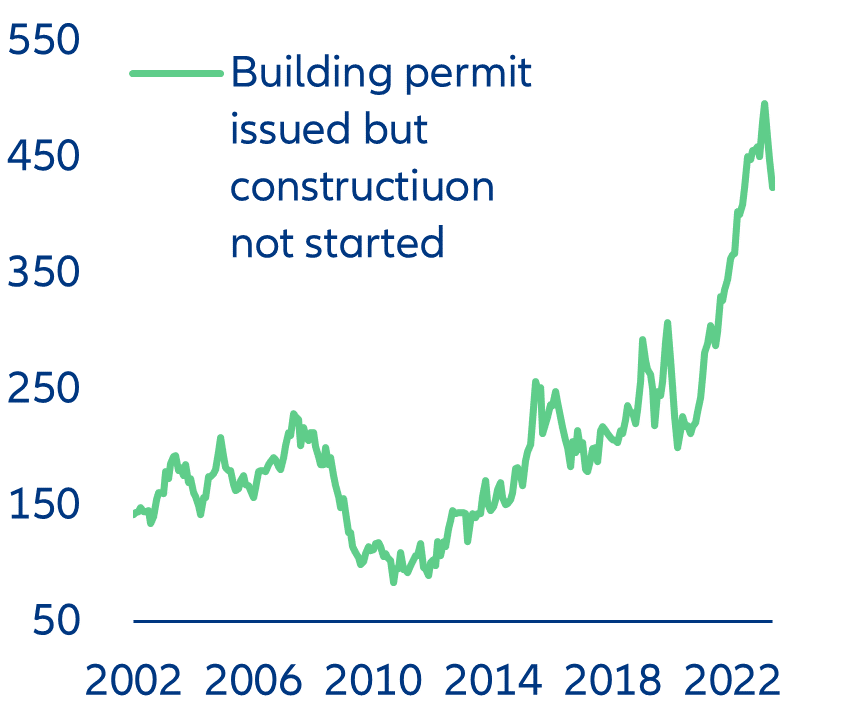
Sources: Refinitiv Datastream, Allianz Research
Property prices have started to pick up again, but the recovery will be sluggish compared to the last two cycles. Housing prices in April (measured by the S&P Case-Shiller index) are -1.8% off their cyclical peak (reached in June 2022) in nominal terms, and -5.3% in real terms. They started to pick up again on a monthly sequential basis since February, despite a rapidly improving supply of new units and lacklustre demand. However, the flows of housing credit – historically a fairly good short-term predictor of y/y real house-price growth – remains deeply negative (Figure 5, left), suggesting latent property price weakness in the next few months despite supportive structural. We remain cautious on the house-price outlook amid the unfavourable demand-supply dynamics and the already-high valuation of the US property market (the price-to disposable-income per capita ratio is historically very elevated). In sum, we expect flat real property prices by the end of the year. Thus, we now expect real property growth of +0.3% y/y in end-2023 (+3.5% in nominal terms), from –5% y/y in April, and a modest +2.2% y/y (+4.1% nominal) in end-2024 (Figure 5, right).
Figure 5: Housing credit & property prices (top); real property-price forecast (bottom)
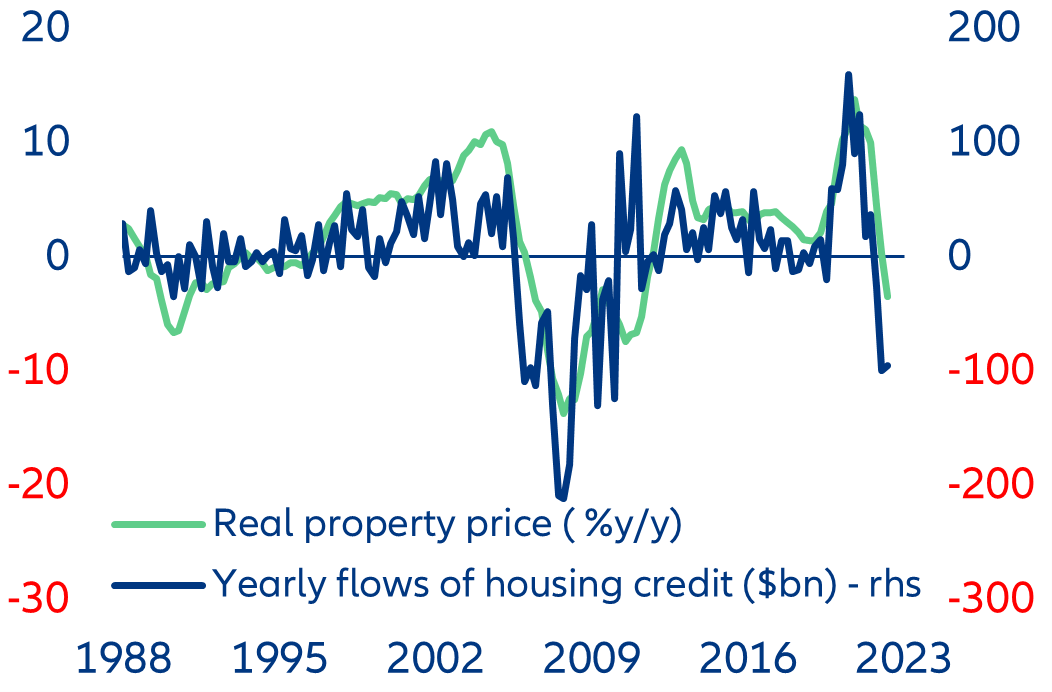
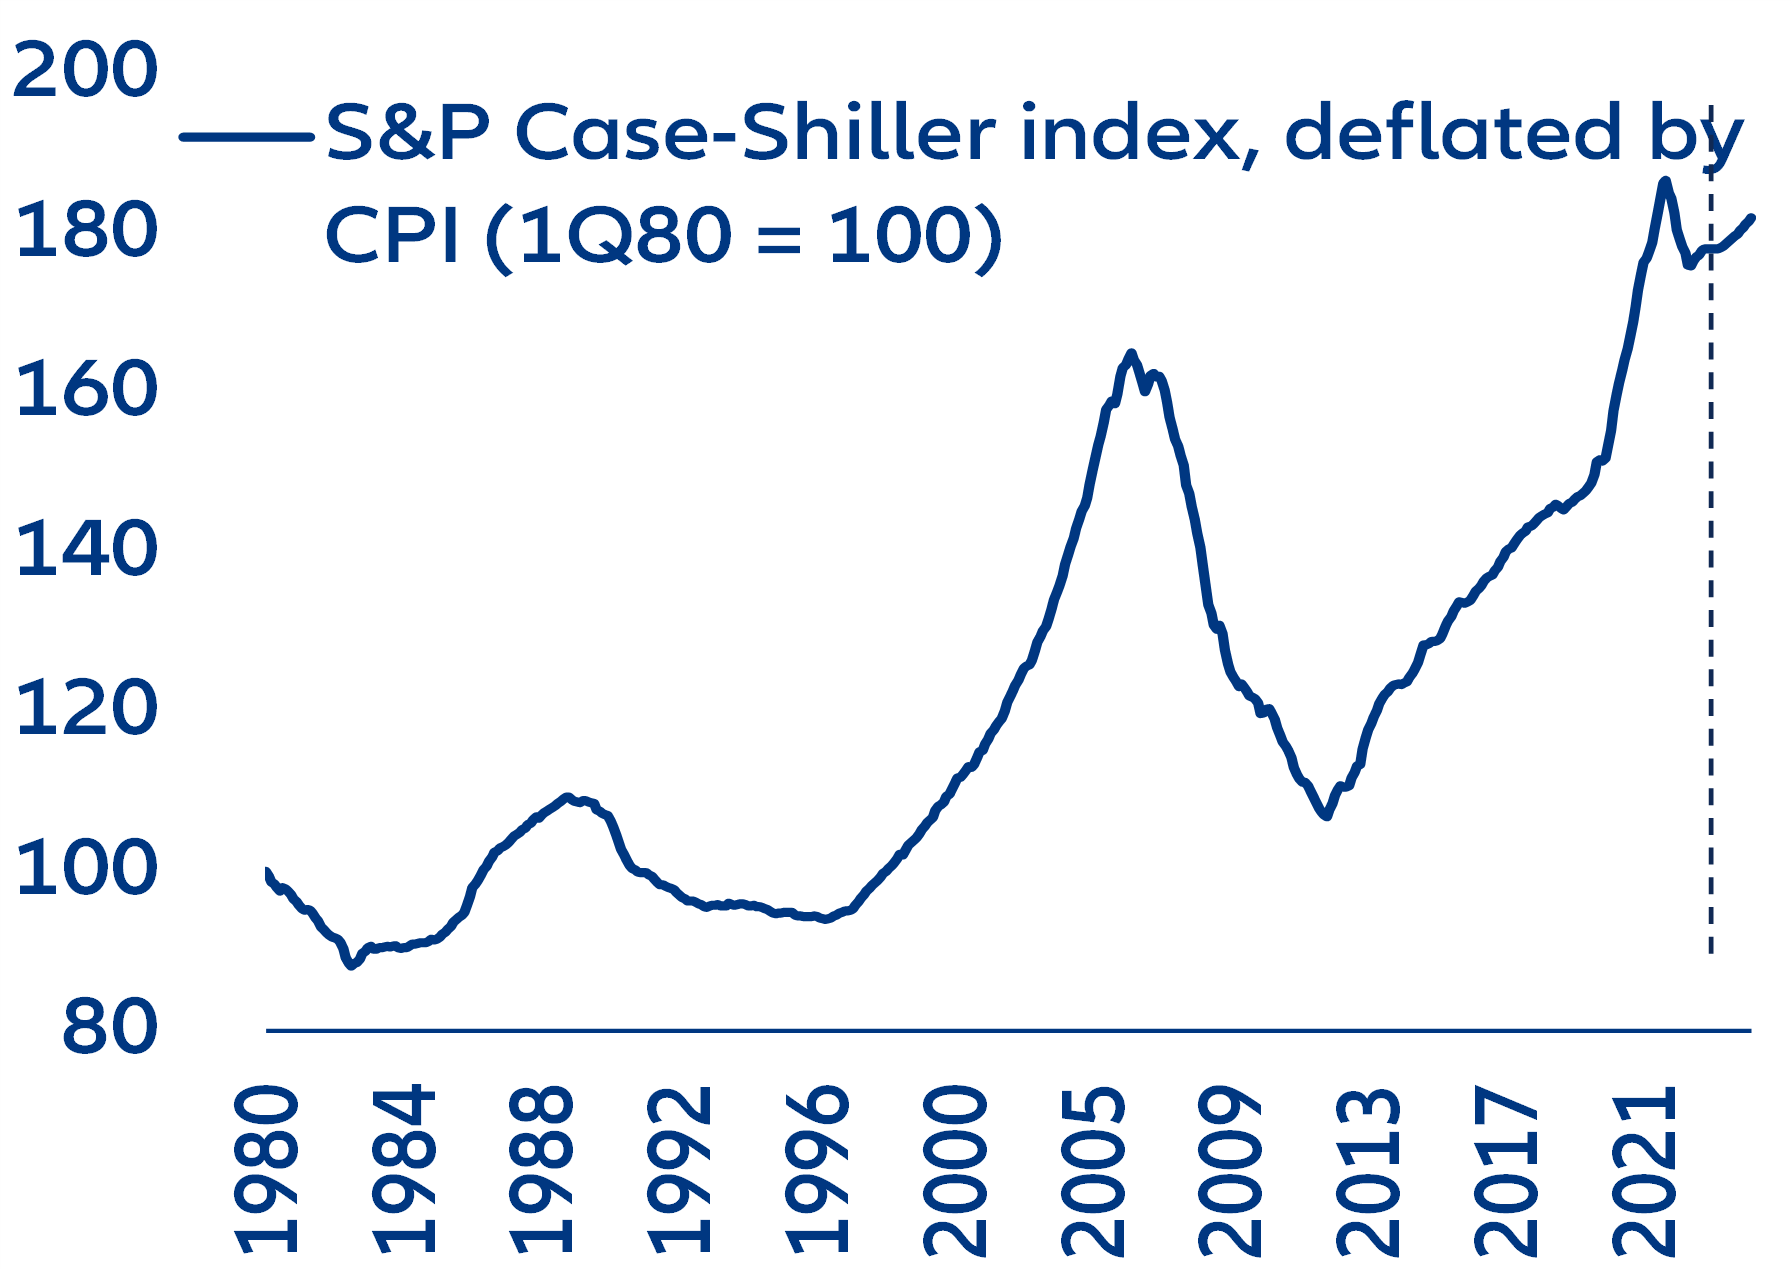
Sources: Refinitiv Datastream, Allianz Research
Negative PMI momentum
Recent sentiment indicators reveal that economic activity in France and Germany has cooled noticeably. For France, the June PMIs revealed a sharp contraction in services – down to 48.0 from 52.5, the lowest figure since February 2021. Manufacturing also disappointed, with the corresponding PMI stuck below 50 for the tenth time since last year. Germany experienced a sharp decline in both manufacturing and services PMIs, which was confirmed by the ifo business climate indices (Figure 6). The weakness in manufacturing concerns all subsectors as more and more firms assess their order books and incoming new orders as too low. At the same time, sentiment slipped markedly in transport and logistics geared towards manufacturing, which may partially explain the weakness in the services PMI.
Figure 6: German manufacturing and services PMI compared to ifo business climate in manufacturing and services (index and net balance)
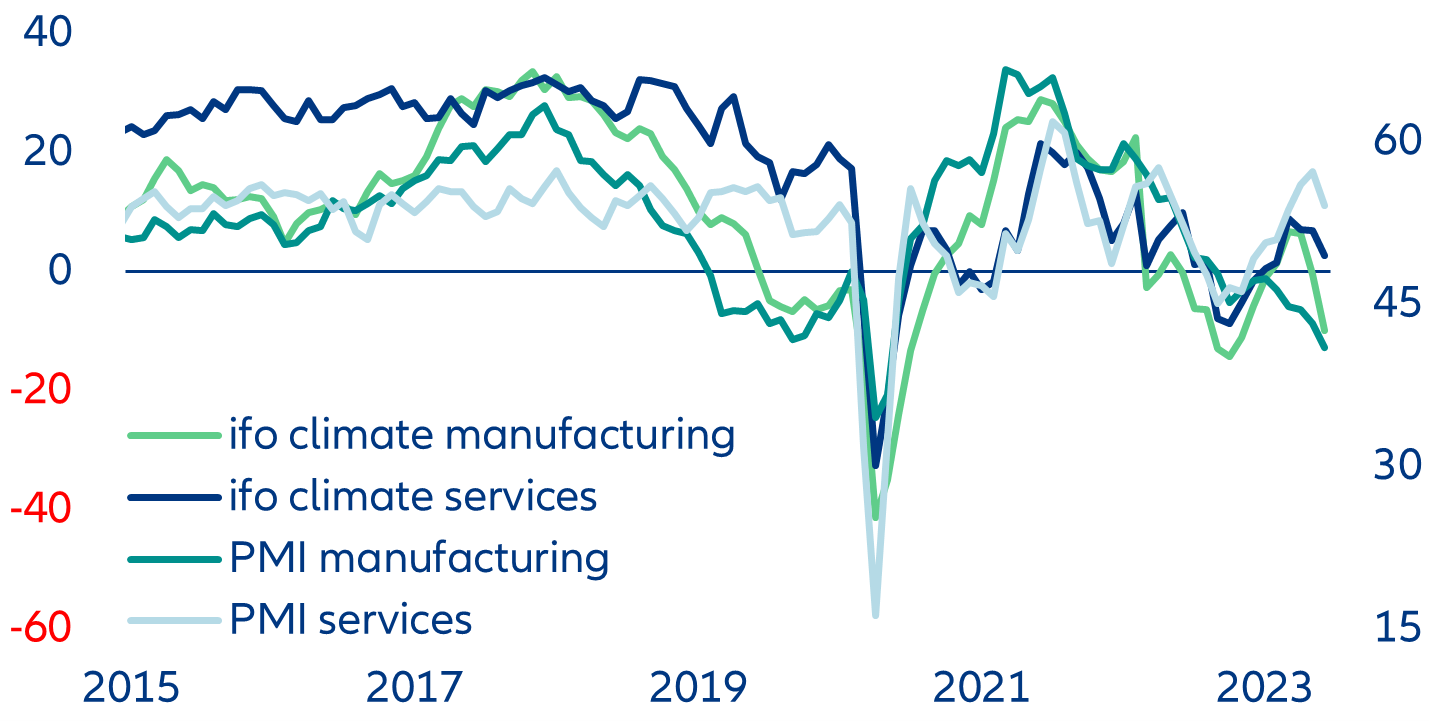
Sources: Refinitiv Datastream, Allianz Research.
The outlook for economic activity in the largest Eurozone economies remains a mixed bag...for now. In Germany, another quarter of negative growth in Q2 seems likely and growth will underperform relative to France, where sentiment still holds up better. But the weak June PMI for France suggests that our expectations of a GDP drop in France in Q3 are materializing. After a positive surprise in Q1, Italy’s positive momentum might not hold; consumers are increasingly upbeat but businesses remain less optimistic. In Spain, available data so far seem to be consistent with still resilient economic activity in Q2. This momentum should continue into the summer, supported by the services sector and the strong rebound in tourism. But the question remains how Spain will sustain its current growth rate as other large Eurozone economies are slowing.
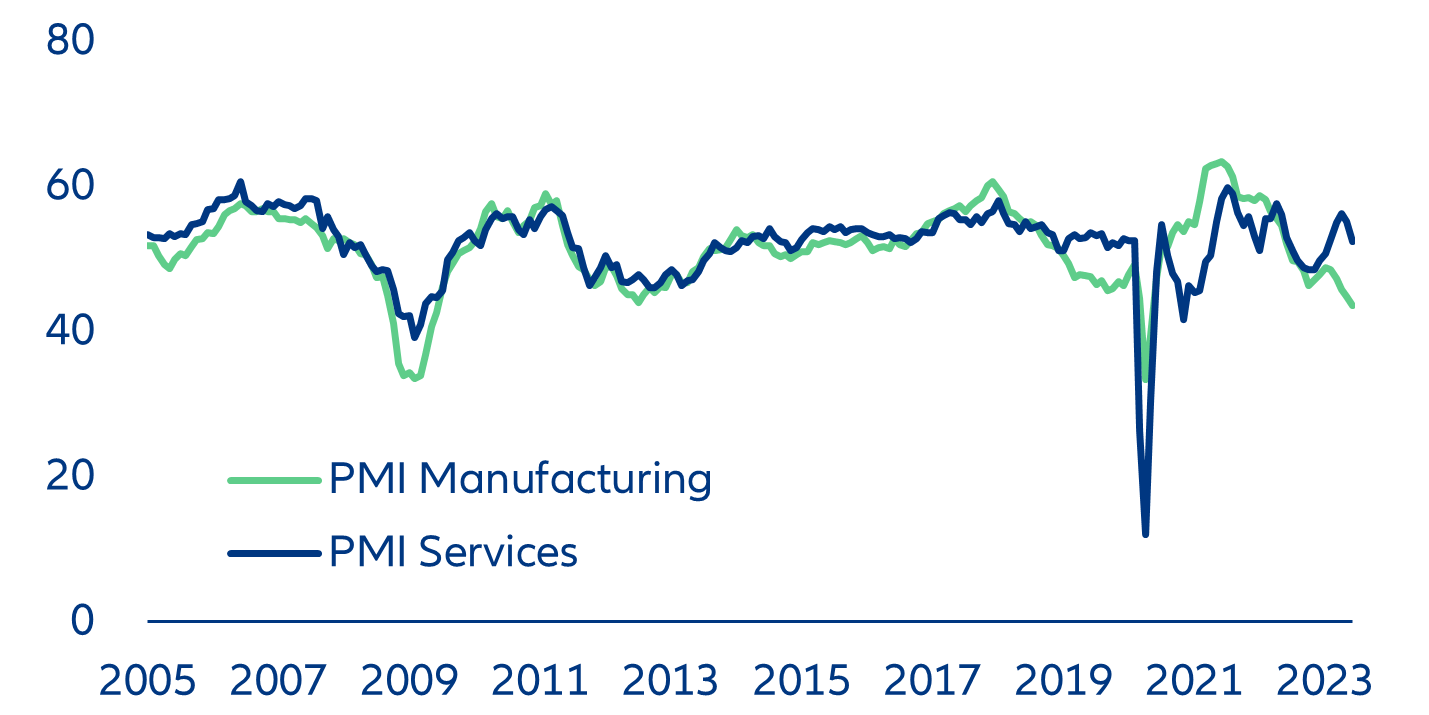
These poor results suggest continued stagnation in the Eurozone. The Eurozone composite business activity index fell to its lowest level since the beginning of the year. The manufacturing PMI came in at 43.6 and the services PMI plunged by 2.7pps compared to May 2023 (Figure 7). Manufacturing has been at its lowest level, apart from the pandemic dip, since the economic and financial crisis in 2008/2009 when the Eurozone economy shrank by more than -5%. While services have so far held up better than manufacturing, the sharp plunge brings both closer together again, with the consequence of a gloomy economic outlook for the Eurozone as a whole for the rest of the year.
Figure 7: Eurozone manufacturing and services PMI (index)
Sources: Refinitiv Datastream, Allianz Research
Corporate debt maturity walls in Europe and the US
Higher interest rates and widening corporate bond spreads will further raise corporate borrowing costs until the end of next year. Firms need to roll over a considerable amount of maturing debt: In the US and the Eurozone, about 20% and 30% of total investment grade corporate credit will need to be refinanced over the next two and a half years. The current average cost of debt for this portion is far lower than current rates at which firms will be able to refinance (Figure 8).
Figure 8: Maturity profile of corporate bonds (in percent of total debt outstanding %)
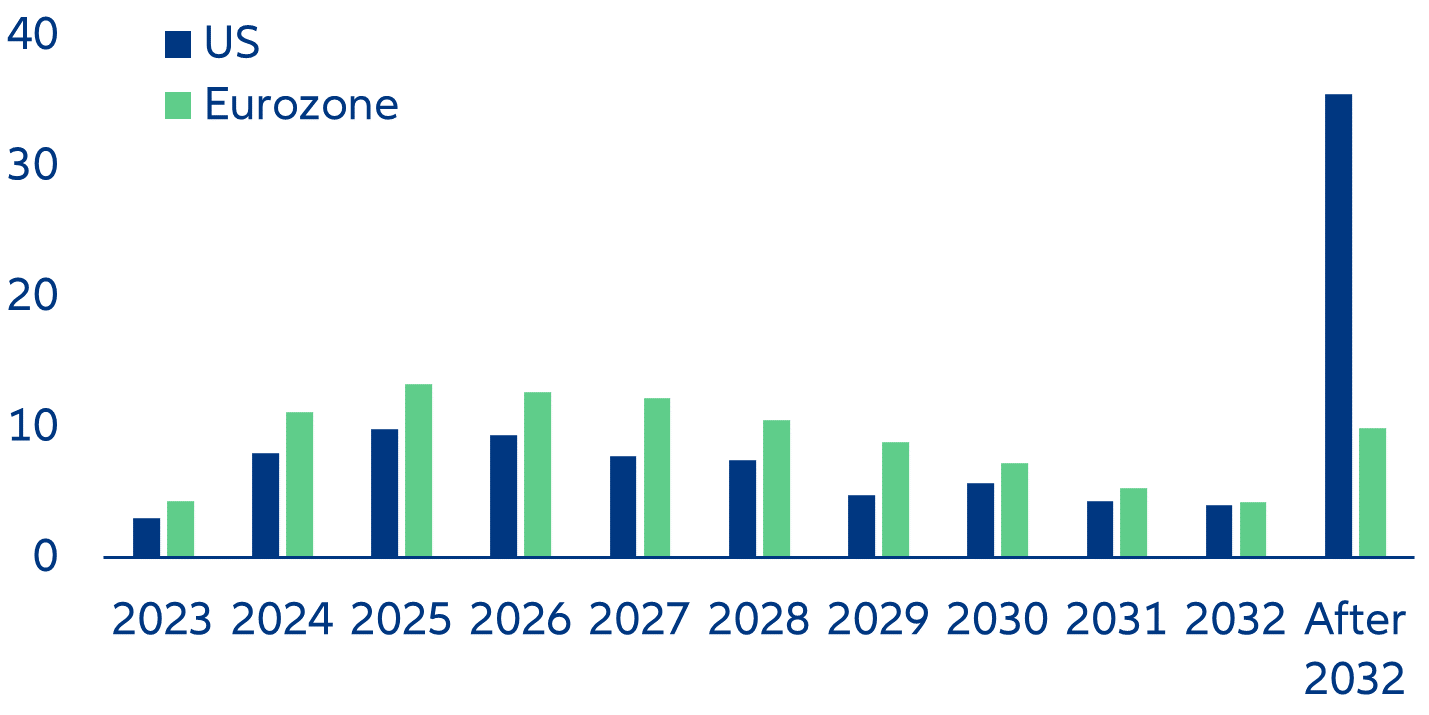
Sources: Refinitiv Eikon, Allianz Research. Note: excluding perpetual bonds.
The expected refinancing wave will adversely affect debt-servicing ratios over the near term, especially in the Eurozone. In particular, the interest-coverage ratio, which assesses the relationship between EBIT (Earnings before Interest and Taxes) and the interest expense, is projected to deteriorate significantly, especially in 2023. If higher financing costs outpace earnings growth, default risk will increase. However, in 2024 and 2025, US companies are expected to outperform European counterparts as the expected acceleration in US earnings should outpace the overall increase in financing costs. In contrast, in the Eurozone, higher refinancing needs paired with a relatively stronger increase in refinancing costs will most likely outpace earnings generation growth, setting the stage for a continued erosion of debt-repayment capacity until 2025 (Figures 9 and 10).
Figure 9: US corporates – interest coverage vs investment grade yield and coupon
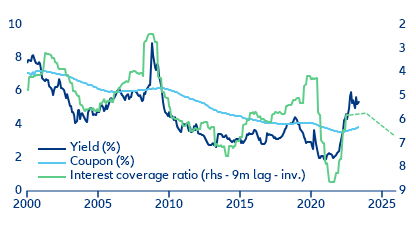
Sources: Refinitiv Datastream, Worldscope, Allianz Research. Note: Interest rate coverage ratio = EBIT / interest expenses; corporate yields are kept at current levels throughout the simulation.
Figure 10: Eurozone corporates – interest coverage vs investment-grade yield and coupon
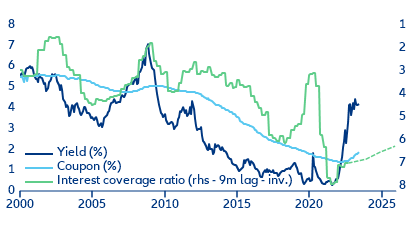
Sources: Refinitiv Datastream, Worldscope, Allianz Research. Note: interest rate coverage ratio = EBIT / interest expenses; corporate yields are kept at current levels throughout the simulation.
An overall deterioration in credit risk through 2023 will widen corporate spreads. Although financing costs are expected to remain elevated for the foreseeable future, there is a possibility of sharp spread-widening if macroeconomic and geopolitical developments take an unfavorable turn and cause debt-servicing capacity to deteriorate further, resulting in a modest increase in rating downgrades and defaults. However, it is unlikely that markets will witness a surge in “fallen angels” (bonds downgraded to “junk status”) or defaults. Given the inverted yield curve, we also expect companies to secure financing at a lower cost by extending the maturity profile of their traded debt (Figure 11).
Figure 11: US and European investment-grade yield curves (in %)
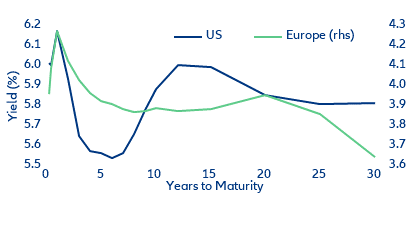
Sources: Refinitiv Datastream, Allianz Research
In focus – De-dollarization and FX reserves? Not so fast…
Recent efforts by some emerging markets (EMs) to diversify their currency reserves away from the US dollar have raised questions about the beginning of the end of USD dominance. However, the dynamics of the USD’s decreasing share in global currency reserves are far more intricate than official statistics suggest (Figure 12). The key factors often overlooked when discussing official currency reserves are that (1) any persistent change ultimately mirrors the currency composition of trade (rather than an ad hoc policy choice, such as the strategic positioning of the Chinese renminbi as trading currency) and (2) the currency choice depends heavily on the availability of liquid instruments in efficient markets (paired with legal certainty and effective governance). Both factors are likely to support the status of the US dollar as the world’s premier reserve currency for the time being. However, the rising share of alternative currencies in global trade and the deepening of EM capital markets will chip away at the dominant status of the US dollar over time, without causing a regime change.
Firstly, the availability of liquid financial assets heavily influences the composition of FX reserves. The USD reigns supreme due to the depth and liquidity of its securities market (how most FX reserves are held), while other contenders such as the Chinese yuan (CNY) face challenges such as limited liquidity and accessibility. Additionally, the fragmented market of the euro (EUR) and the high degree of Japanese financial authorities' participation in the Japanese yen (JPY) market diminish their chances. When it comes to a hypothetical BRICS currency, many look at how the ECU or the SDR work, but the role that the USD has played or continues to play in their functioning is sometimes disregarded (Figure 13).
Figure 12: Decomposition of global official FX reserves (by currency)
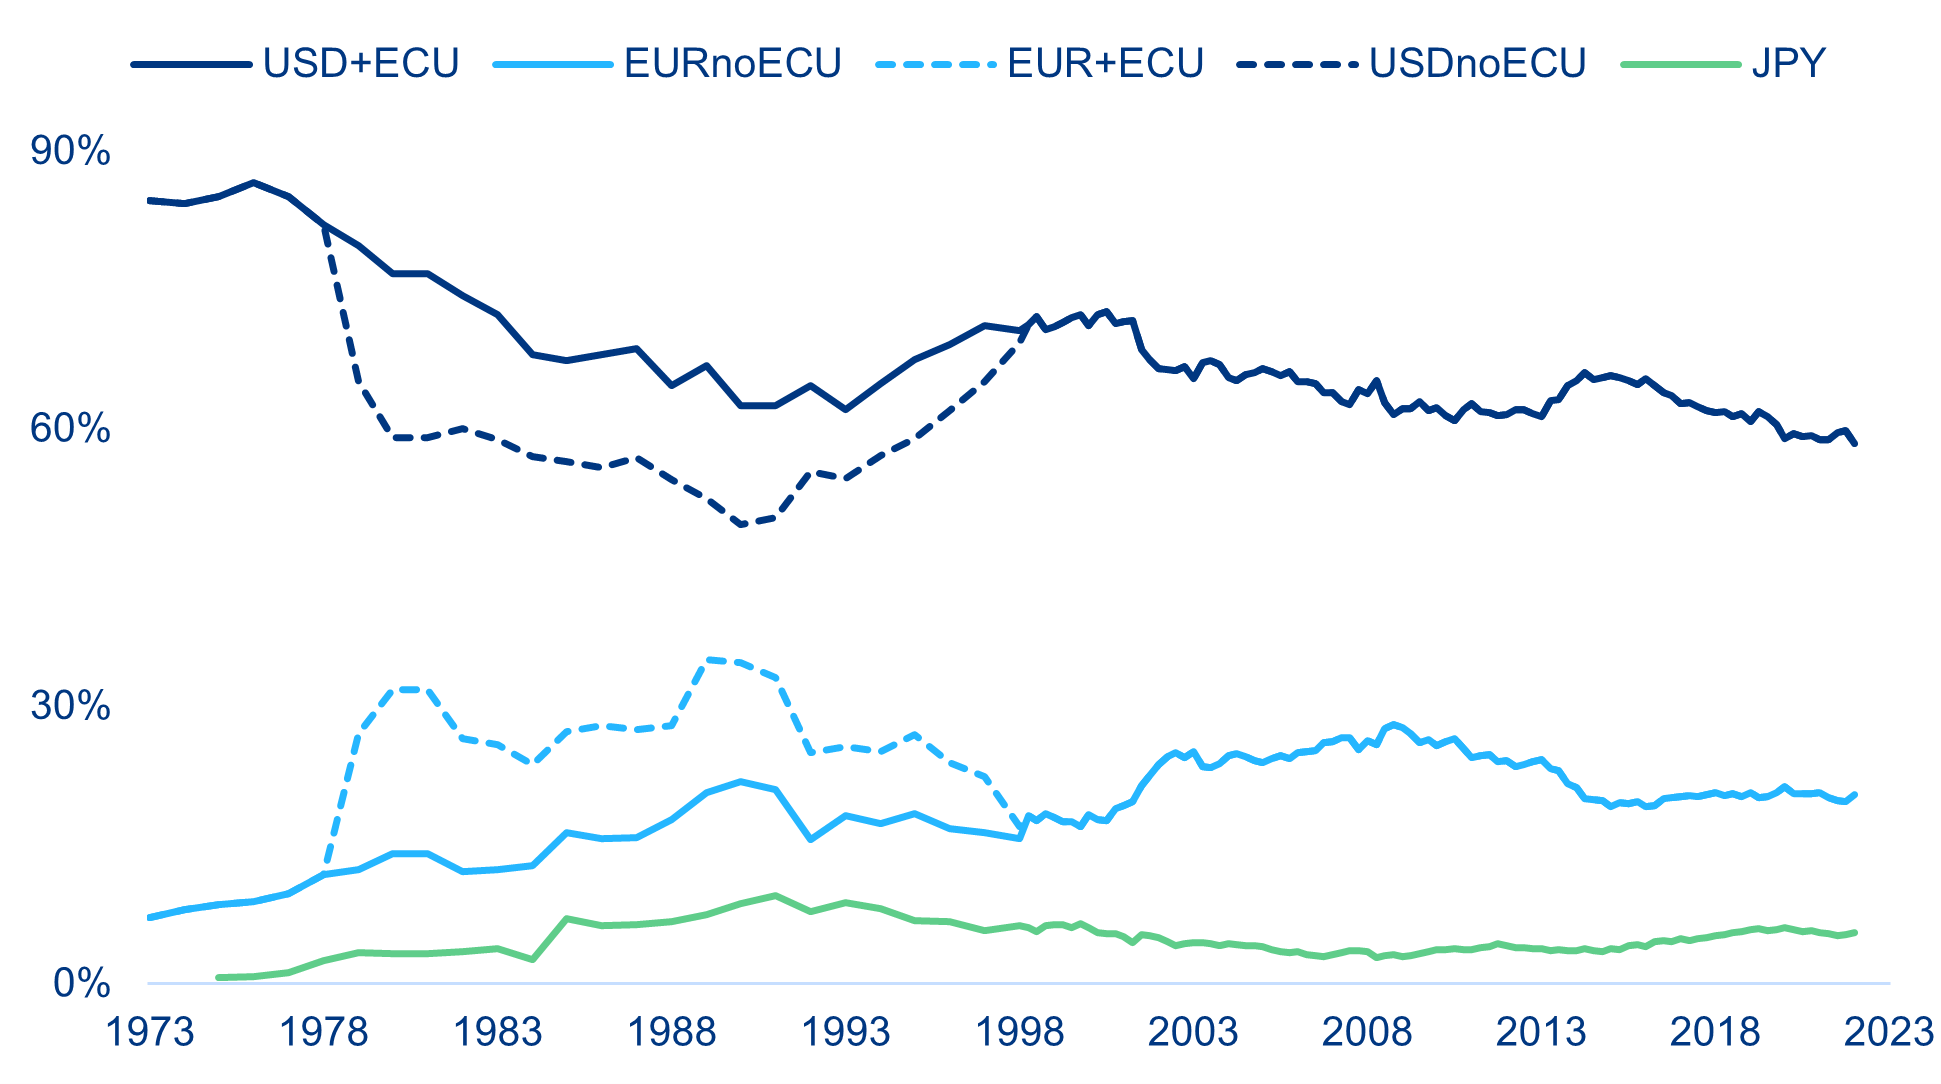
Sources: IMF, Refinitiv, Allianz Research. Notes: 1/ EUR before the euro introduction represents the sum of Deutsche Mark, French Franc and Dutch Guilder (and ECU when it applies); 2/ The ECU were issued against a basket of USD and gold; as a result, in its annual reports in the 1980s and 1990s the IMF presents the ECU share in two ways: (i) including it as an individual reserve currency or (ii) adding the value of the ECU issued against USD as part of the USD reserves and excluding the part issued against gold from the total FX reserves. Since the reports seem to prefer the latter in the 1990s, the ECU share is shown as a continuous line, while we have portrayed the former (taking the ECU as a separate reserve currency) using discontinued lines.
Figure 13: Issuance of sovereign bonds (top) and non-financial corporate bonds (bottom) by currency (in USD bn)
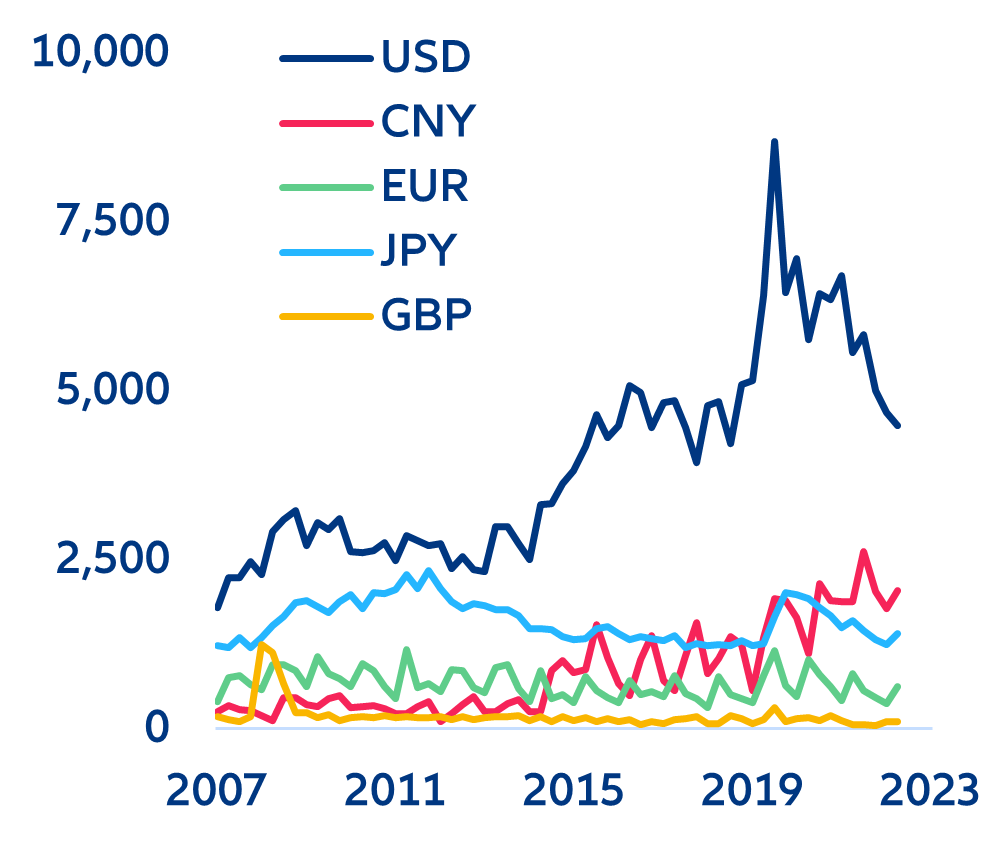
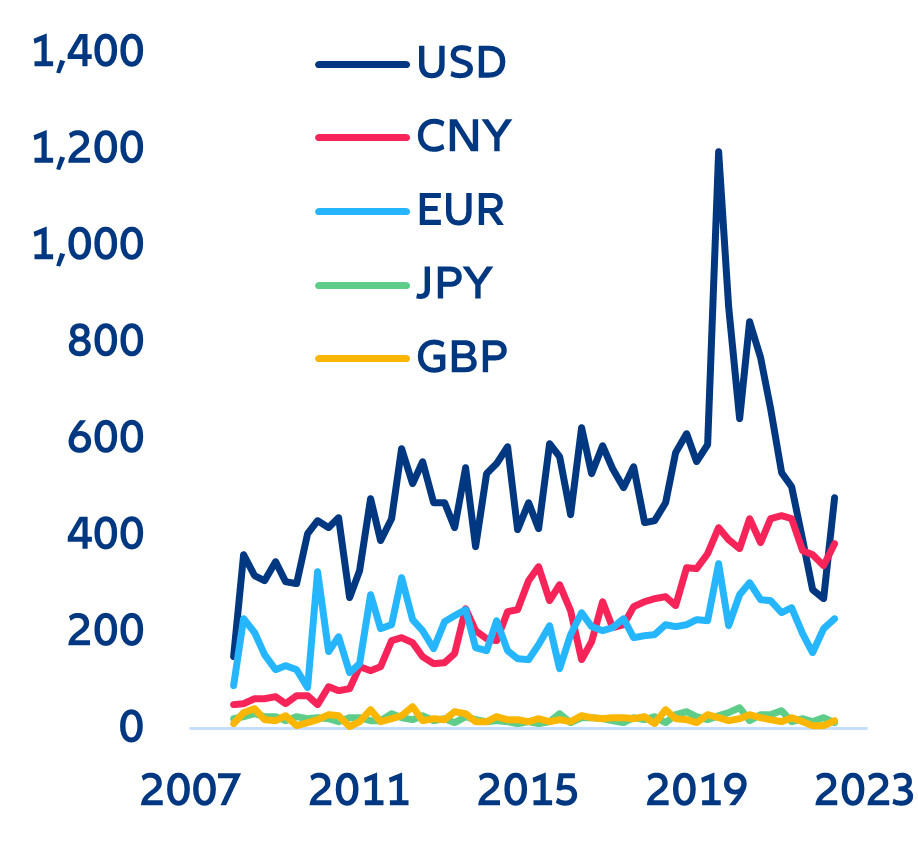
Sources: Bloomberg, Allianz Research. Notes: 1/ We aggregate all issuances of all government’s levels, agencies and supranational entities; 2/ All issuances are included, not only those that were issued by the country to whose currency we refer.
Figure 14: Total return losses in sovereign bonds in selected countries (since Nov. 2022)
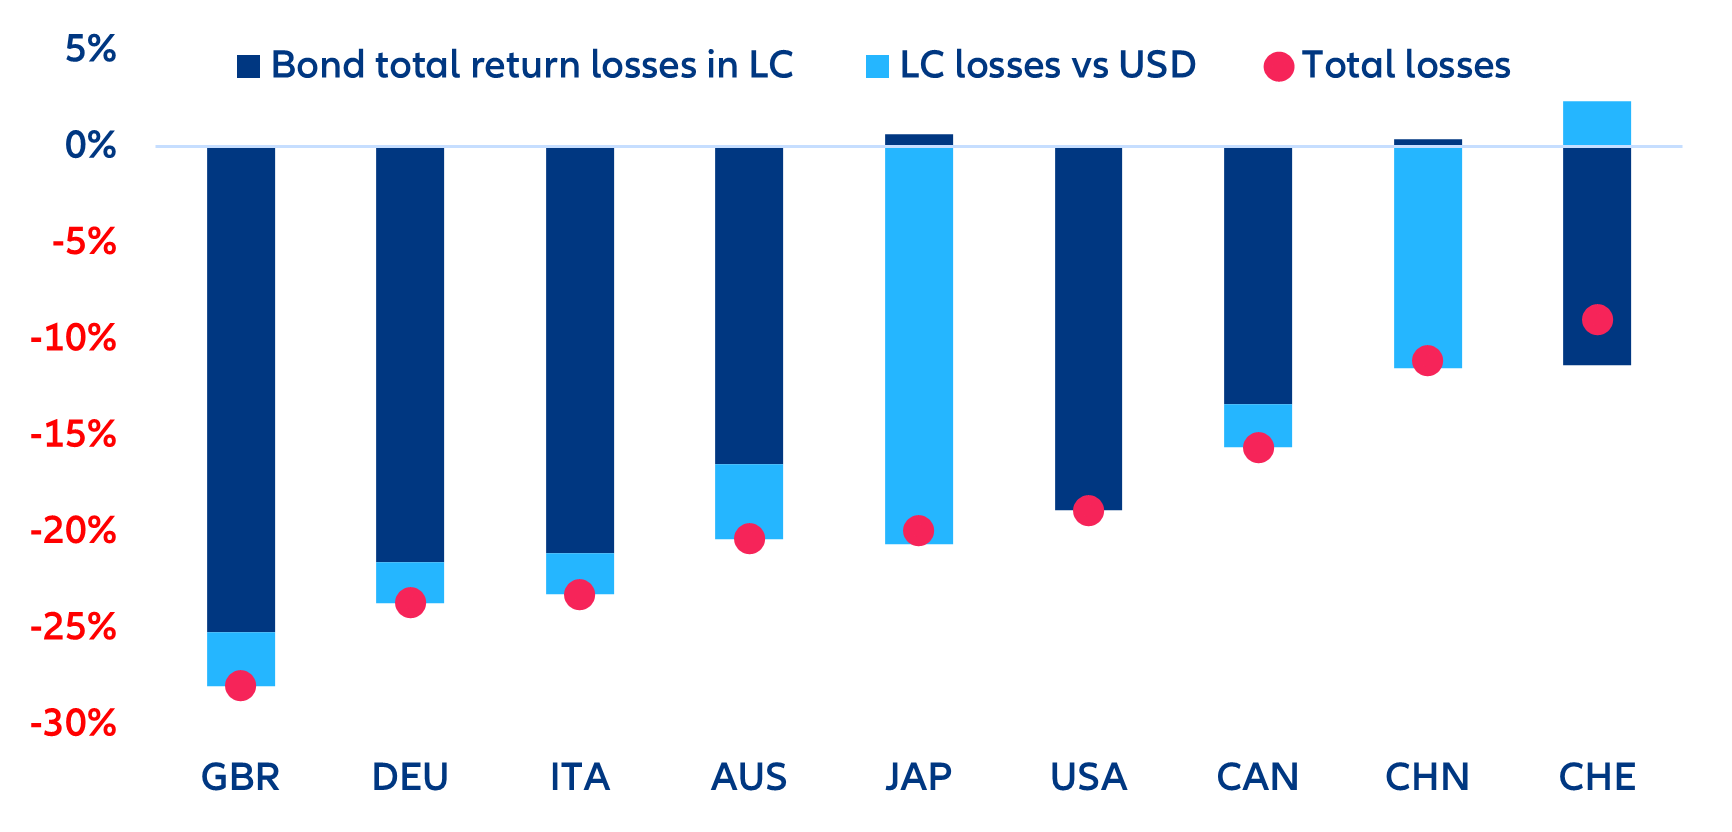
Sources: Refinitiv, Allianz Research
Since last year, the net effect of an appreciating USD on the composition of currency reserves was not substantial. It was argued that a stronger USD overstates its real share in global currency reserves since the nominal share of the USD would rise without changes in allocation. However, this is not the whole story: the strong USD appreciation of the USD last year was caused by higher interest rates, which also resulted in a lower valuation of USD-denominated securities (Figure 14). In fact, central banks in several countries, including the Bank of Japan (the second-largest holder of FX reserves), sold USD-denominated securities to ease depreciation pressures on their currencies, which diminished the share of the USD in their reserves (and also their valuation due to a lower valuation of USD-denominated securities). Several large EMs with significant FX reserves also sold US Treasuries in response to depreciation pressures.
Figure 15: FX turnover by currency (%)
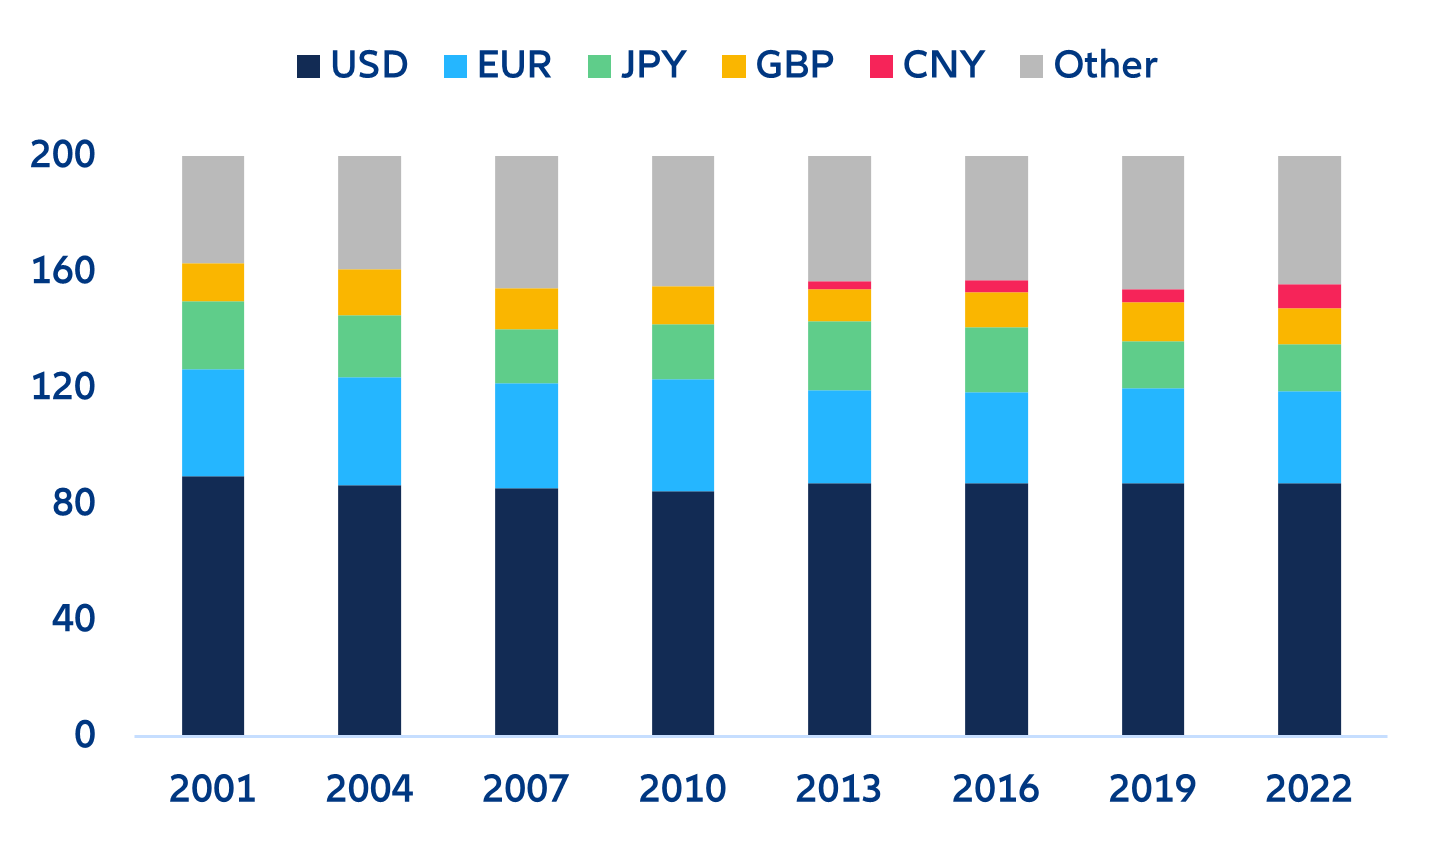
Sources: BIS, Allianz Research. Note: As each transaction involves two currencies, the total adds to 200%, but the shares must be read individually: i.e., the USD was involved in 88% of all FX transactions in 2022.
What will ultimately determine the USD’s role as reserve currency is not the portfolio allocation choice of central banks but rather the private sector’s use of the currency for trade and investment. Over the last decades, the position of the USD in private sector transactions has changed only slightly based on FX turnover (Figure 15), bond issuance by non-financial corporates and SWIFT payments (Figures 16 and 17). And while companies wanting to operate in Asia have been “forced” to participate in local currency markets, these currencies have yet to make a significant dent on the USD when it comes to raising money in international capital markets.
Over the near term, however, a stronger USD would weaken its role as reserve currency. If access to USD becomes more expensive, borrowers will search for alternatives. As USD reserves decline across many EM economies, they become more selective with its use, and try to fall back on local currency finance (e.g. “Liraization” attempts). If taken to the extreme, this situation would amount to a real-life test of Gresham’s Law in the era of fiat money.
Over the longer term, the incipient fragmentation of global trade and more diversified oil demand – if persistent – are bound to strengthen the case for USD alternatives, but any significant switch will take a long time to evolve. The structural change in the oil market brought about by the shale-oil revolution (which allowed the US to become energy independent) can paradoxically hurt the role of the USD as the global reserve currency since oil exporters, which play a crucial role in the USD status (oil prices, large shares of USD reserves), would need to re-orient themselves to other countries and their currencies. In addition, the Covid-19 pandemic and the war in Ukraine have led to a rethinking of globalization by both advanced economies (by creating more resilient supply chains) and EMs (by challenging the US dominance over the global financial system). Both developments have resulted in an incipient trend in the commodities market: some EMs have decided to use alternative non-USD currencies (typically CNY). However, a pivot to alternatives will take a long time due to substantial obstacles, especially when it comes to attracting foreign investment, which require a stable currency.
Figure 16: Share of SWIFT CNY-denominated transactions (outside China, Hong Kong and Macao, by country)
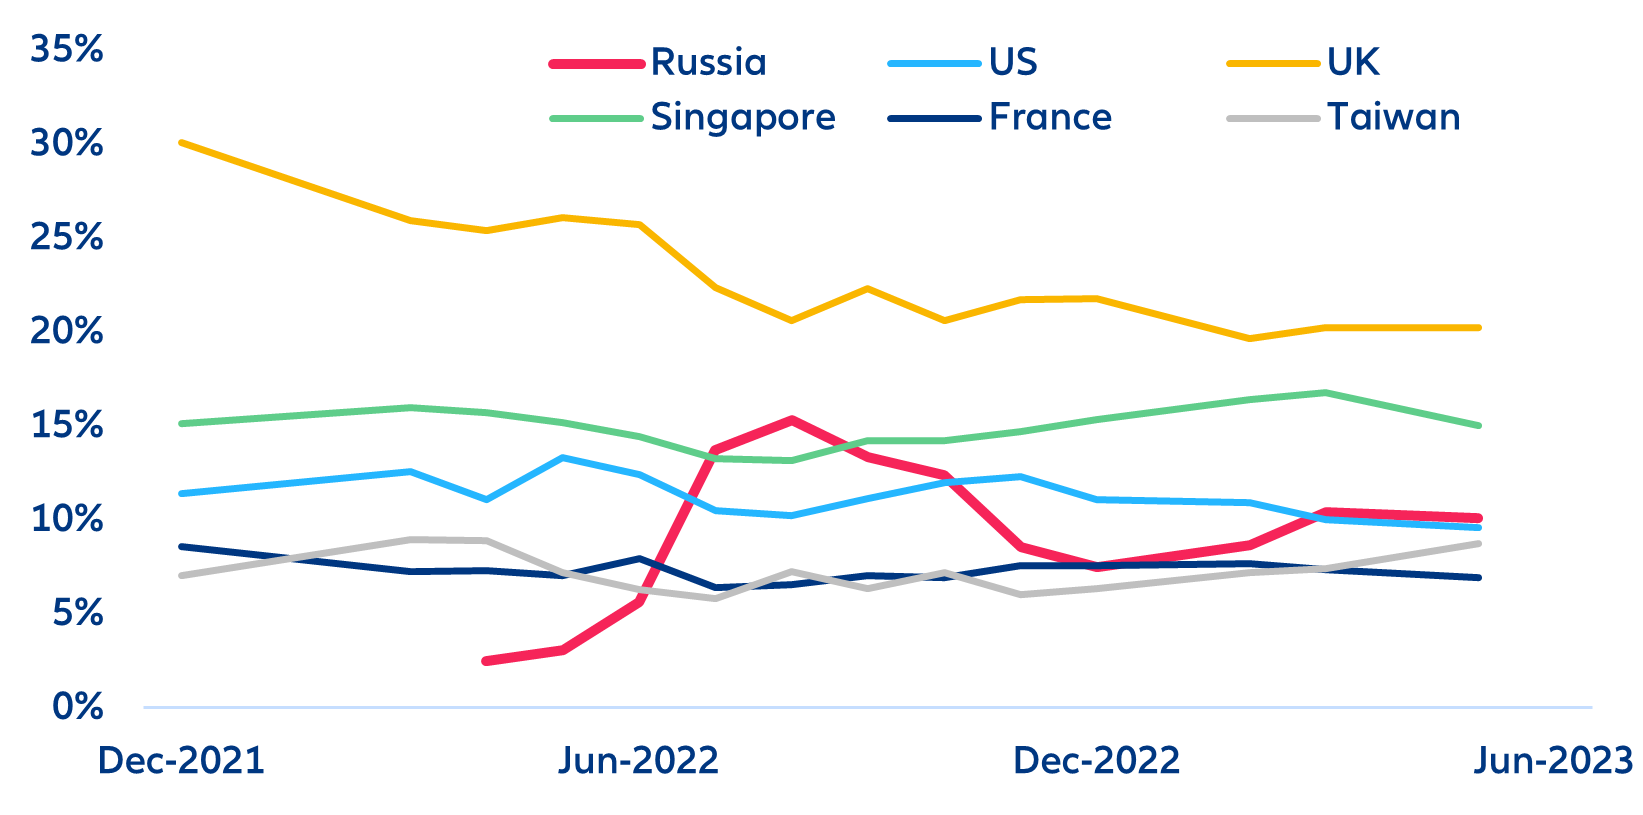
Sources: Swift RMB Tracker, Allianz Research. Note: Russia was regularly not included in the tracker since it only covers the top 15, but in December 2018, Russia’s share was below 1% vs. 10% currently.
Figure 17: Currency share in global trade finance, based on SWIFT transactions
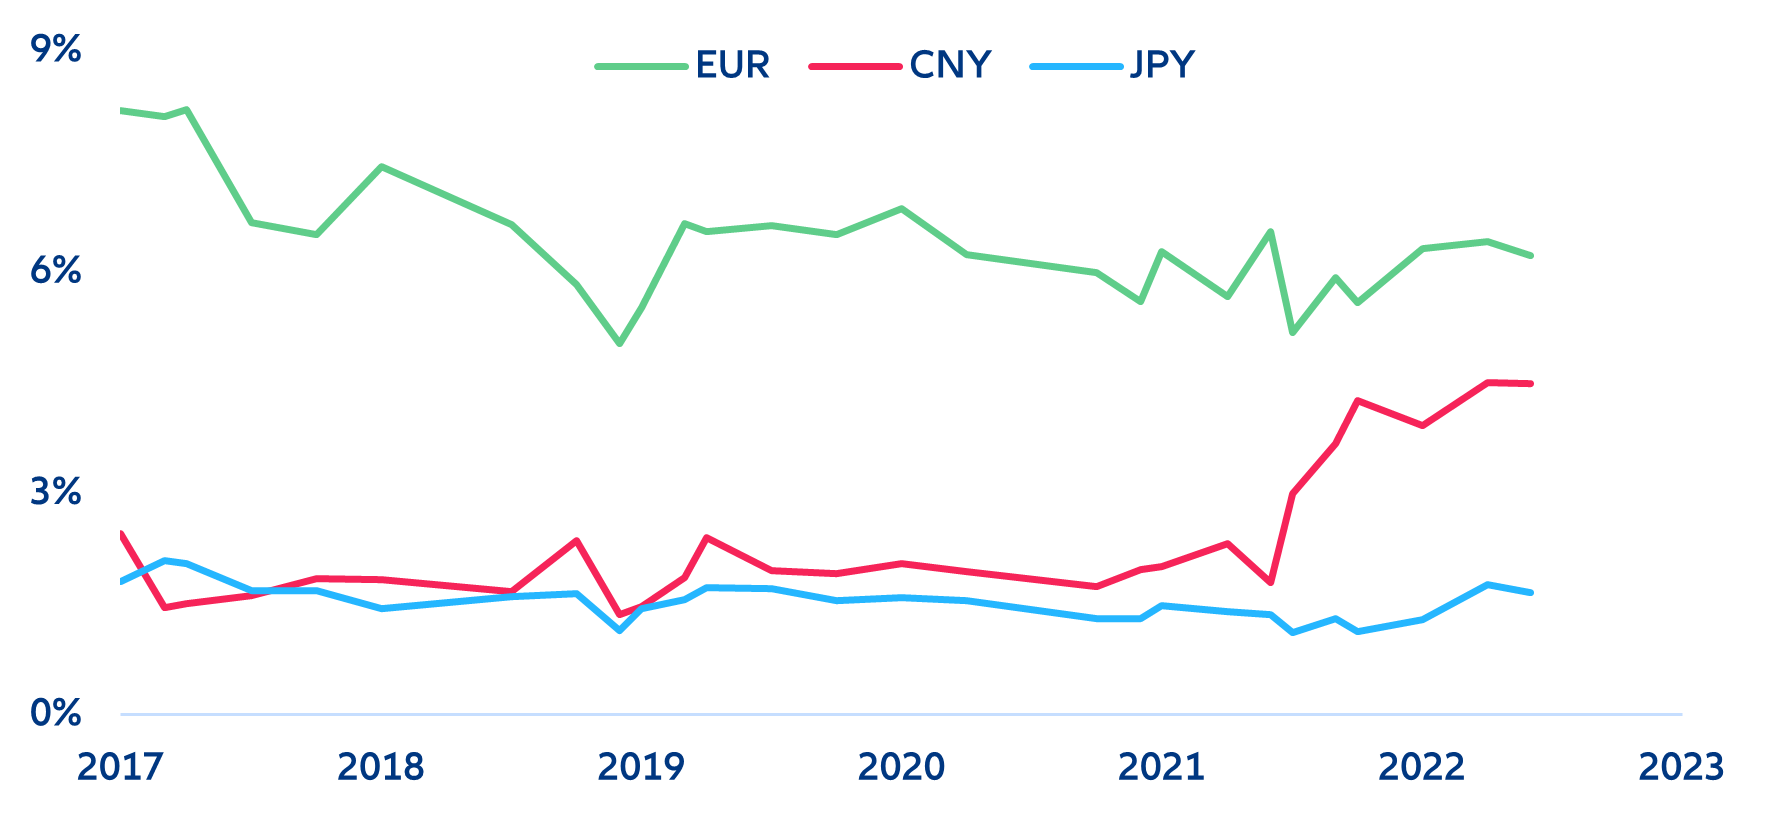
Sources: Swift RMB Tracker, Allianz Research. Note: China has developed its own interbank payment system – CIPS – and has recently prompted its use.