Global household liabilities increased by 5.5 percent in 2016, the highest rate of growth since 2007. That means that debt also rose faster than nominal economic output for the first time since 2009, and the global debt ratio increased by almost 1 percentage point to 64.6 percent. The picture varied widely between individual regions.
Growth accelerated slightly – starting from a moderate level – in Western and Eastern Europe and in North America. Latin America experienced a further decline in growth. In Asia (excluding Japan), on the other hand, debt growth rose sharply by a further four percentage points to just under 17 percent; at the top were Chinese households which ratcheted up their liabilities by a whopping 23 percent. That means that this region accounts for almost 20 percent of global private liabilities of just under 41 trillion euros, compared with less than 7 percent ten years ago.
“The debt situation in China should be closely monitored,” commented Michaela Grimm, co-author of the report. “Although the debt ratio of households is not yet in the danger zone, dynamics are alarming: The ratio jumped by 17 percentage points in the last five years, and by almost six points in 2016 alone – both figures are globally outstanding. Just to compare: In the five years prior to the Great Financial Crisis, the debt ratio in the USA increased by roughly 20 percentage points. The Chinese supervisors should not make the mistake to believe that China would be immune to a financial crisis; timely countermeasures would be better.”
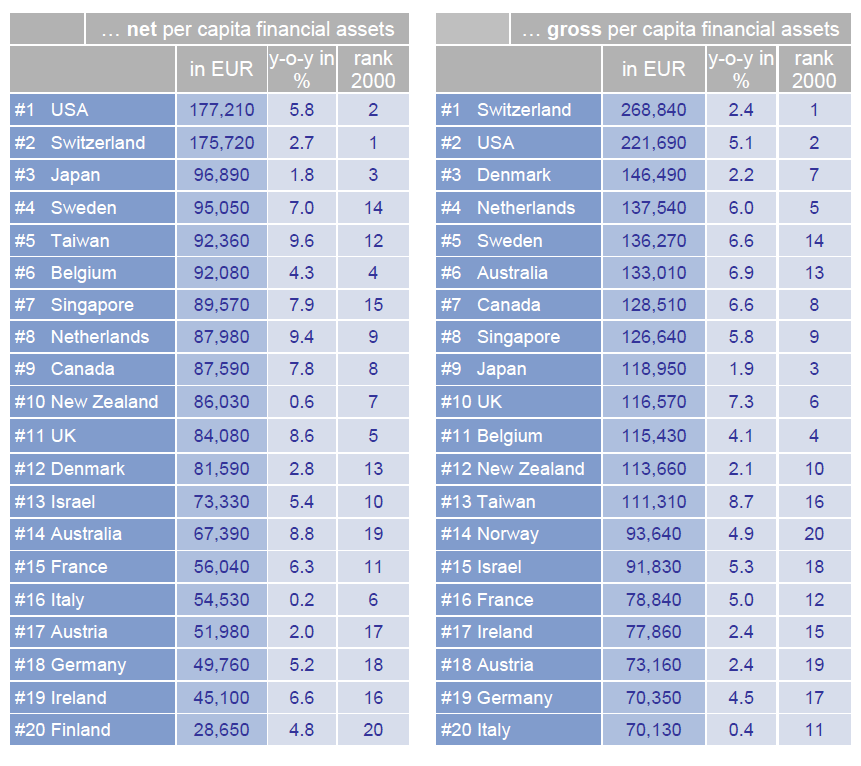
Despite the steep rise in debt, net financial assets – gross financial assets minus debt – reached a new global record high of 128.5 trillion euros at the close of 2016. That represents an increase of 7.6 percent year-on-year. Although this is slightly below average for the years since the crisis, it is well above the previous year's growth of 4.8 percent.