- Half of the decline in US inflation since last year is the making of the Fed. The fall of inflation to 3% in June has cheered markets by strengthening the argument that the US economy can achieve a soft landing, avoiding a recession and normalizing inflation. We find that the Fed has contributed to lowering inflation through two channels: (i) by cooling aggregate demand growth (-2pps) and (ii) by managing to keep inflation expectations anchored (-3pps). In total, the Fed has pulled inflation down by -5pps over the past 12 months.
- The fading of supply-chain disruptions contributed equally to lower inflation. The mix of spiking demand for goods during the pandemic and pandemic-related disruptions to global supply chains (notably in Asia) had been the first trigger, pushing US inflation to historical highs. Now that global supply chains are operating as normal, goods inflation has dropped and this has contributed to reducing US inflation by -5pps.
- However, demand-push factors have pushed up inflation by close to +4pps. US GDP growth has been remarkably resilient to Fed tightening because of offsetting factors including labor market strength, solid household consumption growth funded by excess savings, and loosening fiscal policy (since early 2023).
- Looking ahead, we forecast US inflation to hover around 2.5-3.0% through the end of 2023, and to reach around 2% by the summer of 2024. Rapid declines in inflation are behind us now that energy inflation is set to become less negative in the months ahead. However, core inflation and food inflation should continue to ease as lower input costs, squeezed corporate margins and slowing wage growth feed through. We forecast both headline and core inflation at around 2% by the summer of 2024. Our expectation of a soft landing of the labor market is compatible with inflation returning to 2%.
In focus – US immaculate disinflation: How much should we thank the Fed for?
ECB Governing Council meeting – not much higher but for longer
The Eurozone economy is likely to remain in a technical recession, recording another quarter of negative growth in Q2 while inflation remains uncomfortably high and tightening financing conditions weigh on domestic activity. Current survey data suggest that the weak growth momentum has continued over the recent months amid slowing production, declining order volumes and extraordinary low investment. Recent manufacturing and order data from May suggest that the Eurozone will record another quarter of negative growth. Confidence indicators point to a clear reversal of the positive soft-data momentum since the beginning of the year, which is underpinned by a rotation to services carrying the growth momentum. At the same time, the still relatively tight labor market has kept wage pressures high but stubbornly high inflation has chipped away at real household incomes, which are recovering slowly, keeping consumption subdued (Figure 1). Overall, aggregate demand is stagnating, which should help enforce the disinflationary trend over the recent months.
Figure 1: Eurozone—Wage dynamics and core inflation

Sources: Refinitiv Datastream, Allianz Research. Note: the wage pressure index is based on the survey measure of limits to production based on scarce labor and short-term inflation expectations.
Even though inflation has slowed, largely due to the impact of government support measures, price pressures will abate only slowly during the second half of this year. We expect governments to increasingly pare back spending as rising interest rate burdens require fiscal consolidation. Annual inflation still runs close to three times the ECB’s price stability target of 2%. Headline inflation decreased to 5.5% y/y in June (6.1% y/y in May), thanks to falling energy and food prices (-5.6% y/y and 11.7% y/y) – despite higher inflation in Germany – and core inflation increased (again) to 5.4% y/y (5.3% y/y in May) but remains below the historical record of 5.7% y/y in March. However, energy inflation will drop precipitously during the coming quarters (due to strong disinflationary base effects) and represent less than 10% of overall inflation this year.
Given the current stagflationary environment, the ECB would need to formulate a forward-guidance on its policy rate path that does not excessively slow aggregate demand and considers that the economic impact of tighter financing conditions operate with an even longer lag. Higher rates tame inflation via credit tightening, which fully impacts demand (consumption and investment) with a lag, historically 12-18 months. The dramatic decline in money supply in the Eurozone until now indicates that retrenching credit has already slowed consumption and investment, which will help bring down inflation. However, there are reasons to believe that this lag is slightly longer this time around (resulting in diminished effectiveness of restrictive monetary policy to normalize inflation): (1) because a large part of inflation was supply driven (energy and food prices) and (2) extraordinary quantitative easing prior to inflation shock together with a loose fiscal stance during the pandemic and the energy crisis has kept both system-wide liquidity and excess savings high, supporting aggregate demand. There are also additional factors explain why it has taken so long for the ECB to reverse the inflation trend until now:
- Household debt burden: higher mortgage rates have a strong impact on supply of new homes and demand for existing homes, which preserve household wealth; moreover, many households have switched to variable rate and mortgage loans over the recent years.
- Corporate debt burden: diminishing rollover risk due to lengthened debt maturity profile (but refinancing cost significantly higher in 1-2 years)
- Lower capital-intensity of capex: intangibles/software are less sensitive to tighter financing conditions
- Fiscal support: fiscal consolidation is small on average this year (e.g., negative fiscal impulse of only 0.5% in Eurozone
Figure 2: Eurozone—Real rates and headline inflation

Sources: Refinitiv Datastream, Allianz Research. Note: */ defined as policy rate less short-term (1 year) inflation expectations
The ECB will maintain a restrictive monetary policy path based on a three-pillar approach by making future policy rate changes dependent on the incoming economic and financial data, the dynamics of underlying inflation and the strength of monetary policy transmission. While inflation is cooling, core price pressures are still too strong for the ECB to pause. Services inflation will remain elevated for the remainder of the year, with wages accelerating on the back of continuously robust demand, notably for tourism. High core inflation will reinforce the ECB Governing Council’s conviction that further rate increases are still needed. The strong appreciation of the euro since June should also weigh on inflation and growth prospects.
We keep to our call from the June Economic Outlook that the ECB will hike by 25bps at the Governing Council next week, which has become market consensus over the last few weeks. We also forecast one more 25bps hike in September for a terminal rate of 4.0%, with the ECB maintaining a restrictive stance until mid-2024 and only likely to cut rates in 2024 if its forecast in December this year (or March 2023) shows that the inflation target of 2% can be reached over the medium term. Given the current divergence between the inflation forecasts from ECB staff and Eurosystem national central banks (NCBs), concerns about financial stability and debt sustainability could politicize the decision of rate cuts during the second half of next. This will also influence how quickly real rates have actually risen and the extent to which they are tightening financing conditions in their own right without further rate rises (Figure 2).
Spanish elections – low economic consequences, high (supranational) social and political impact
A 180-degree turn on the way? In the wake of major defeats in the recent regional and local elections on 28 May, Prime Minister Pedro Sanchez of the Socialist Workers’ Party (PSOE) has called for early elections in Spain, to be held on 23 July (instead of December as originally planned). With this decision, PM Sanchez hopes to avoid further damage to his party and to break the positive momentum of the center-right parties. Whether this strategy will pay off remains to be seen. The latest polls (Figure 3) continue to show a shift to the right, with Alberto Nunez Feijoo’s Partido Popular (PP) beating PM Sanchez’s Socialists (PSOE). However, PSOE has narrowed the widening gap with the right since the regional elections, indicating that the outcome of the general elections remains uncertain.
Figure 3: Voting intentions

Sources: various sources, Allianz Research
Figure 4: Estimates of the number of seats each party will win in accordance with the latest polls

Sources: Multiple sources, Allianz Research. Note: estimates are based on the average of the most recent polls (delivered on 17 July).
A significant social change (maybe) just around the corner. In the last decade, the Spanish political landscape has undergone a significant transformation, with a notable increase in the number of parties. This fragmentation has led to greater instability as coalition governments need to be formed, often on the basis of a fragile consensus. The polls suggest that the center-right PP party is likely to win the most votes but fall short of majority needed to form a government. To secure the majority of the 350 seats needed to form a government, the PP would almost certainly have to ally itself with the far-right VOX party (Figure xx), a move that could give the far right a role in Spain’s government for the first time since the end of Francisco Franco’s dictatorship in 1975. Controversial measures on immigration, abortion and gender are likely to return to the agenda as the party clearly advocates defending ‘traditional’ Spanish values, as well as the Spanish nation vis à vis internal and external threats (secessionists and immigrants, respectively). Note, however, that according to recent polls, a parliamentary majority (176 seats) for a right-wing alliance (PP-VOX) is not yet assured (Figure 4), but given that the PP has a history of doing better in elections than the polls indicate, the possibility of a parliamentary majority is quite likely.
A new right-wing government could impact current economic policy. The left-wing government of PM Pedro Sanchez has adopted a series of measures and reforms aimed at increasing spending and/or social rights. For example, to finance the various fiscal stimulus measures announced last year to contain the energy crisis, the government introduced temporary windfall profit taxes on the energy and banking sectors to raise around EUR 6 billion over the next two years. If a right-wing government comes to power, these measures are likely to be reversed, as the two parties have different approaches to taxation. While the current left-wing PSOE government proposes to reduce the tax burden on families with dependents and to maintain the property tax, the PP has emphasized the need to reduce the personal income tax (IRPF) for individuals earning less than EUR 40,000 per year (about 85% of the total) and to reduce the VAT on basic goods to compensate for inflation. It is also likely that a right-wing government would seek to relax some of the regulations introduced by the new labor reform. On the energy front, the planned closure of nuclear power plants in 2027 could be delayed to ensure energy supply. However, the extent of these policy changes will depend on the consensus among the coalition partners and the strength of their majority.
No matter who wins, fiscal consolidation will be key. The reactivation of European fiscal rules in 2024 will increase pressure on fiscal-consolidation measures. Regardless of the election outcome, addressing public finances will be inevitable, thus limiting any attempt to pursue more expansionary fiscal policies. While the economic rebound in 2021-2022 and surging inflation as a result of the energy crisis helped to improve the deficit and debt ratios, the next Spanish government will need to take more action going forward. While a left-wing government would likely raise taxes, a right-wing alliance would most likely focus on cost-cutting (Figure 5). Note that the fiscal effort to be made in the coming years is likely to be significant, considering the pressure that will be exerted by the pension reform that took effect this year, which links pensions to the previous year’s inflation index. The IMF estimates that such a reform could increase pension expenditure by 3.2-3.5% by 2050, on top of the 1pp due to population aging. In the context of the National Recovery and Resilience Plan (NRPP), the European Commission has asked the Spanish government to reintroduce an adjustment factor that would adapt initial pension benefits to changes in life expectancy and the intergenerational equity mechanism. The failure to adopt these measures would reduce future tranches of EU recovery funds allocated to Spain, which has been one of the main beneficiaries of the mechanism.
Figure 5: Fiscal balance (% of GDP)

Sources: Refinitiv Datastream, Allianz Research
Economic and financial risks should be limited, regardless of whether the next government is left- or right-wing. The Spanish economy has maintained good momentum, with economic activity finally close to pre-crisis levels. In the first quarter of the year, it was one of the best-performing countries in the Eurozone, helped by net exports, especially services boosted by a continued rebound in tourism. In addition, the Spanish economy benefited from some structural differences, such as a relatively smaller industrial sector compared to Germany, for instance. It is precisely this energy-intensive industry that has suffered the most from higher energy prices and the slowdown of global manufacturing trade.
Figure 6: Contributions to real GDP growth

Sources: Refinitiv Datastream, Allianz Research
We expect Spain to grow by +2% in 2023, outperforming major Eurozone peers. Leading indicators suggest that the resilience continued into the second quarter. For the second half of the year, we expect the weakness in private consumption observed so far to ease, thanks to improvements in real income resulting from the observed decline in inflation (we expect headline inflation to reach 3.8% in 2023 and 3.4% in 2024) and expected wage increases (4.6% in 2023 and 4.1% in 2024%).

Sources: Refinitiv Datastream, Allianz Research
However, the country continues to face challenges due to structural weaknesses such as high debt and low productivity, as well as established labor-market underperformance, characterized by high and persistent unemployment and temporary work, largely above levels seen in among European peers (Figure 6). To address the latter, the Spanish government adopted a new labor reform at the end of 2021, restoring some of the workers’ rights lost in the past – and, above all, addressing the problem of the high incidence of temporary work in the country. To date, we note that the reform has led to a major shift in the employment profile, with a robust increase in permanent contracts (Figure 7). But it is still too early to draw definitive conclusions about the reform and its impact on the functioning of the labor market.
Figure 8: Employment contract by type

Sources: Refinitiv Datastream, Allianz Research
While we do expect a coalition to be formed after the elections, there remains the possibility that the PP and Vox will not be able to reach an agreement, which would lead to a hung parliament, necessitating new elections and prolonging political uncertainty. In such a scenario, reforms could be delayed. In any case, note that the formation of the new government may take time. Parliamentary activity will resume after the formation of the new houses; the constituent session is scheduled for August 17, and an investiture process involving King Felipe VI of Spain, meetings between the partners and several votes in the Assembly must be completed. So far, markets have not reacted to the potential political change. However, continued uncertainty about future government policy could weigh on investor confidence and hamper investment activity.
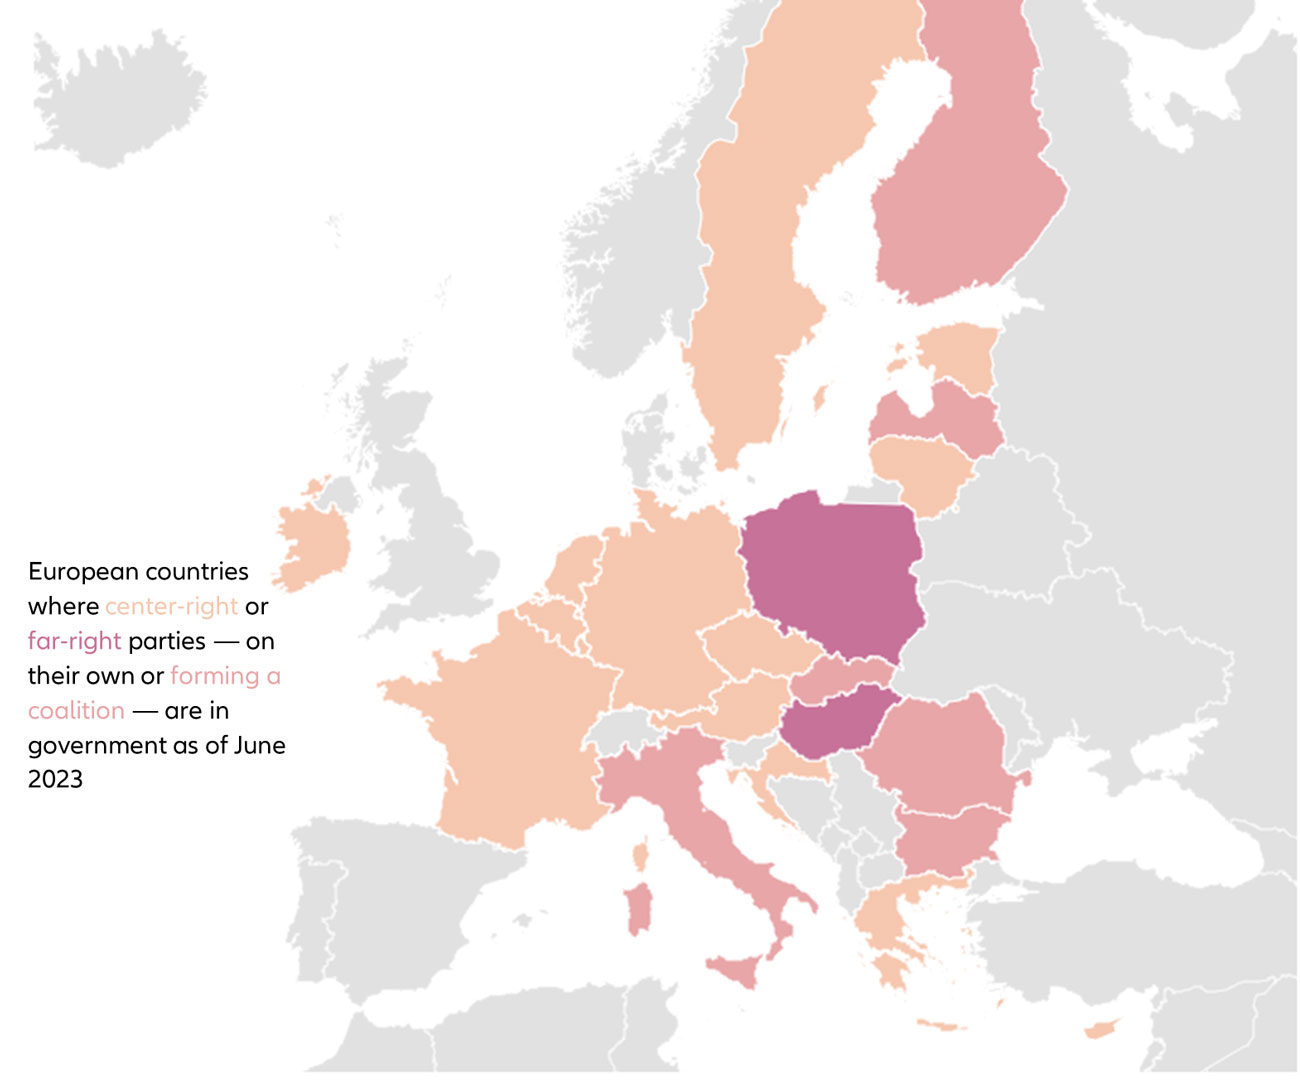
The results of the elections could also shift the balance within Europe. Given that the election comes less than a month after Spain assumed the presidency of the EU Council, a PP-Vox alliance would allow the far right to set the agenda for Council meetings. A shift to the right in Spain would very likely throw into doubt difficult negotiations on fiscal rules next year, and the Spanish government’s unlikely alliance with the Netherlands could be in jeopardy. Other initiatives, such as promoting sustainable economic growth, fostering social and territorial cohesion, strengthening European identity and consolidating the fight against climate change, could also hit a stumbling block. Moreover, given the recent rise of traditional and far-right parties across the EU (Figure 9), and with the EU set to elect a new European Parliament next year, such a rightward trend at the national level could mean a more conservative Brussels at a time when critical decisions will be made on issues such as the EU’s eastward expansion, trade with China and policing the rule of law in EU countries.
Sinking global trade is a fact
Ongoing goods trade recession. After entering a technical recession (-1.9% q/q in Q4 2022 and -0.7% q/q in Q1 2022), global trade continued to disappoint in April (-1.4% m/m). The latest figures from China – a bellwether for global trade – paint a rather gloomy picture. China is grappling with an intensifying trade recession as the value of goods shipped overseas nosedived by -12.4% y/y in June, the sharpest annual drop since the onset of the pandemic in February 2020. Growth of 12-months cumulative exports now stands in negative territory (Figure 10). But this trend is not specific to China: Other Asian trade powerhouses have also reported a slump in exports. From Taiwan’s -23% y/y dip to Vietnam’s -11% y/y drop and South Korea’s -6% y/y decline, the data signals a deepening slowdown in global trade, mainly due to lower demand from consumers, notably for goods, and lower investment intentions from firms. After a spending spree on consumer goods during the pandemic, consumers have pivoted towards the service sector (Figure 11), thereby reducing demand for computers, electronics and household equipment, to name a few. Surging borrowing costs are also curbing consumer and business spending, particularly in the US and Europe, adding another layer of pressure on global trade. These developments are in line with our forecast for global trade decreasing by -0.9% in volume terms in 2023, followed by a timid recovery.
Figure 10: Change in 12-months cumulative exports (June 2023, y/y%)

Sources: CEIC, Allianz Research
Figure 11: Supply and demand in the services sector

Sources: S&P Markit, Allianz Research
In the Eurozone, lower demand explains 75% of the fall in domestic supply-chain constraints while the rest comes from lower domestic supply constraints, which support domestic production. The inflexion point is likely to be reached in early fall. Using indicators derived from the S&P PMI surveys, we construct an indicator for supply-chain capacity conditions and find a statistically significant relationship with import volume growth and import prices. For the Eurozone, this indicator suggests that falling demand coupled with easing supply constraints have reduced growth of imports in favor of domestic markets and consequently reduced import price pressures. Hence, our estimates suggest that sequential (% 3m/3m) growth of imports and import prices continued to fall in May and June, with a decline of around -3% to -4% in imports and -0.5% to -1.5% in import prices (Figure 12). However, a proxy of future trade with a five-month lead shows that the decline might have bottomed-out as firms continued to destock, given the financing constraints, notably amid high working capital requirements, and that global trade volume growth should turn positive in early fall (Figure 13). By then, the expected Chinese stimulus of at least 1% of GDP and focus on infrastructure and consumer spending should start to bear fruit.
Figure 12: Sequential growth of imports – predictions and realized values

Sources: Refinitiv, Allianz research
Figure 13: Proxy of global trade of goods in volume

Sources: S&P Markit, Allianz Research
What could spark a sustained trade recovery? For one, a recalibration of fiscal policies by major economies towards a more supportive stance could stimulate consumer spending and business investment. A pivot in monetary policy and easing of borrowing costs would also create a more conducive environment for trade. Beyond these, structural changes would provide a more sustained tailwind to global trade (i.e. a U-turn on the recent trend towards “deglobalization”, resolution of geopolitical tensions, structural policies to build export capacities and trade infrastructure).
In focus – US immaculate disinflation: How much should we thank the Fed for?
Can the Fed take all the credit for declining US inflation? Last week, the CPI measure of US inflation for June came out at +3% y/y, cheering up markets with the prospect of inflation finally normalizing. But can the Fed’s tighter monetary policy take all the credit? To find out, we use a simple Phillips curve-based framework, taking into account the following factors: Sequential q/q growth in headline CPI inflation (explained by its lag), the output gap (a proxy for aggregate demand), the oil price, the Global Supply Chain Pressure index (produced by the NY Fed staff) and one-year ahead inflation expectations (produced by the Cleveland Fed, a mix of survey-based and market-based measures) (Figure 14).
Figure 14: quarterly sequential US CPI inflation (% q/q annualized): actual vs. model-based simulated

Sources: Refinitiv Datastream, Allianz Research
While fading supply-chain disruptions did the heavy lifting, we find that the Fed helped just as much. US inflation has fallen by -7pps over the past year. On first glance, it seems that the bulk of the easing stems from the end of supply-chain disruptions (-5pp), with relatively minor contributions from other factors (lower oil prices: -0.6pp; lower inflation expectations: -0.3pp). But this does not mean that the Fed played no role in reducing inflation. If it had not tightened monetary policy, aggregate demand – which the Fed influences through financial conditions – would have been even stronger, pushing up inflation. Moreover, without the strong, credible commitment of the Fed to bring inflation back to 2%, inflation expectations would have drifted upwards, also pushing up actual inflation.
The Fed pulled down inflation by -2pps via the demand channel. We first estimate the demand channel impact of the Fed by looking at the GDP drag of our in-house Financial Conditions Index (FCI). We can then infer the ultimate impact of the GDP drag (a lower output gap) on inflation through our Phillips curve. As Figure 15 shows, our FCI points to very tight financial conditions through Q2 2023. However, GDP growth remains remarkably resilient: many factors including excess savings, labor hoarding, the inflation-induced spike in profits and income relative to interest expenses were cushioning the effect of Fed tightening on aggregate demand. From Q2 2022 to Q2 2023, however, Fed-induced tighter financial conditions knocked GDP by -3pps, according to our FCI. That is, in the absence of Fed tightening, GDP would have been 3pps higher. Inflation, in turn would have been 2pps higher, according to our Phillips curve.
Figure 15: US GDP growth (% y/y) and FCI contribution to GDP growth (pp)

Sources: Refinitiv Datastream, Allianz Research
Secondly, the Fed’s signaling channel contributed to reduce inflation by a further -3pps over the past year. Aggressive rate hikes also helped to ease inflation through a signaling effect, whereby the Fed’s unquestionable commitment to bringing inflation back to its 2% target anchored inflation expectations. Indeed, the level of inflation is primarily determined by inflation expectations: once external shocks subside, actual inflation gradually comes back down to the level implied by inflation expectations, which have remained mostly well anchored close to the Fed’s 2% target through the inflationary shock, barring a temporary spike (Figure 16). Having a credible, inflation-targeting central bank thus played a key role in easing inflation pressures.
Figure 16: Inflation and 1-year ahead inflation expectations

Sources: Refinitiv Datastream, Cleveland Fed, Allianz Research
To approximate this signaling effect channel, we estimate an equation for inflation expectations, which are explained by the Fed’s 2% target and by lagged inflation. Our estimation shows that the Fed’s target has a much larger coefficient than lagged inflation, consistent with a credible Fed. We then run a counterfactual where we flip the coefficients, starting in Q2 2022. In this counterfactual, the Fed is less credible (private agents form their expectations more on lagged inflation) and consequently inflation expectations drift up. Putting them into our Phillips curve (assuming all other variables do not change from the baseline), we find than between Q2 2022 and Q2 2023, inflation would have been 3pps higher.
With the Fed pushing inflation by -5pps, the resolution of supply-chain disruptions contributing another -5pps and lower oil prices -0.6pps, this means that other factors partially offset these disinflationary effects to the tune of +3.7pps (obtained a residual), consistent with the remarkable resilience of GDP growth. We presume that labor market strength, solid household consumption growth funded by excess savings and loosening fiscal policy (since early 2023) are among these inflation-push factors (Figure 17).
Figure 17: Contributions of q/q annualized CPI inflation decline between Q2 2022 and Q2 2023 (-7pts)

Sources: Refinitiv Datastream, Allianz Research
Figure 18: Food inflation (top) and services inflation (bottom)


Sources: Refinitiv Datastream, Allianz Research
Looking ahead, we forecast US inflation to hover around 2.5-3.0% through the end of 2023, and to reach around 2% by the summer of 2024. As we expect gradual pick-up in the oil price and unfavourable base effects, energy inflation is set to become less negative in coming months, pushing up headline inflation. On the other hand, forward-looking indicators point to rapidly falling food inflation and services inflation (excluding shelter) pushing in the other directions (Figure 18). In all, these opposite forces should keep headline inflation a little bit below the 3% inflation reading, at 2.7% on average through the end of 2023. We see inflation continuing to ease through 2024, in line with our forecast that the economy will go through a weak phase of around 0% sequential q/q growth between end 2023 and mid-2024. We forecast both headline and core inflation at around 2% by the summer of 2024. Note that our Phillips curve points to even lower inflation.
The soft landing of the labor market is compatible with 2% inflation. As we explained in our recent report, we believe that the labor market will continue towards a soft landing in the next 18 months even as the economy weakens. We explained that a combination of squeezed corporate margins and lower job openings should eventually be compatible with a (core) inflation rate of around 2% by next year, with only a small uptick in the unemployment rate. A recent paper by the San Francisco Fed substantiates the argument that low inflation is compatible with a tight labor market: It shows that only a small rise in the unemployment-to-vacancy rate can bring inflation back to 2%, according to a fitted non-linear Phillips curve (Figure 19). The unemployment-to-vacancy rate (currently 0.6) only needs to moderately increase to reach its 2018-19 level (at 0.9), a time when the labor market was tight and core inflation at around 2%. This is consistent with our view that most of the adjustment in the labor market will be engineered by lower job vacancies, and that the unemployment rate will modestly pick up (to 4.2% by Q2 2024) while inflation will settle around 2%.
Figure 19: Nonlinear labor market Phillips curve

Sources: Refinitiv Datastream, San Francisco Fed, Allianz Research