Distraction has always been hard to pin down. It rarely leaves a mark an investigator can point to after a crash, which is precisely why it slips through official statistics. This year the AZT set out to measure it directly, combining crash-database analysis, eye-tracking, cognitive modeling and a review of the wider literature.

Swipe. Tap. Crash.
Driver distraction in the digital car
Driver distraction in the digital car
A report from the Allianz Center for Technology (AZT) for the Allianz Motor Day 2026
International Mobility Summit 2026
International Mobility Summit 2026
Chapter 2
What the research reveals: measuring distraction
Our central finding can be stated plainly: Based on the combined evidence from our studies and the wider scientific literature, the AZT estimates that distraction may contribute to one in three road crashes. It is not always the sole cause, and it rarely leaves a trace in the official record — but it is frequently the factor that turns an ordinary moment behind the wheel into a critical one, and a critical one into a crash. The three findings below set out the evidence.
Database analysis: the record and reality are two different things
The starting point was the German In-Depth Accident Study database (GIDAS). Working with Traffic Accident Research at TU Dresden (VUFO), the AZT examined more than 34,000 injury crashes recorded since 1999, comparing cases with an indication of distraction against those without. The gap between what is recorded and what is visible in the detail is stark.
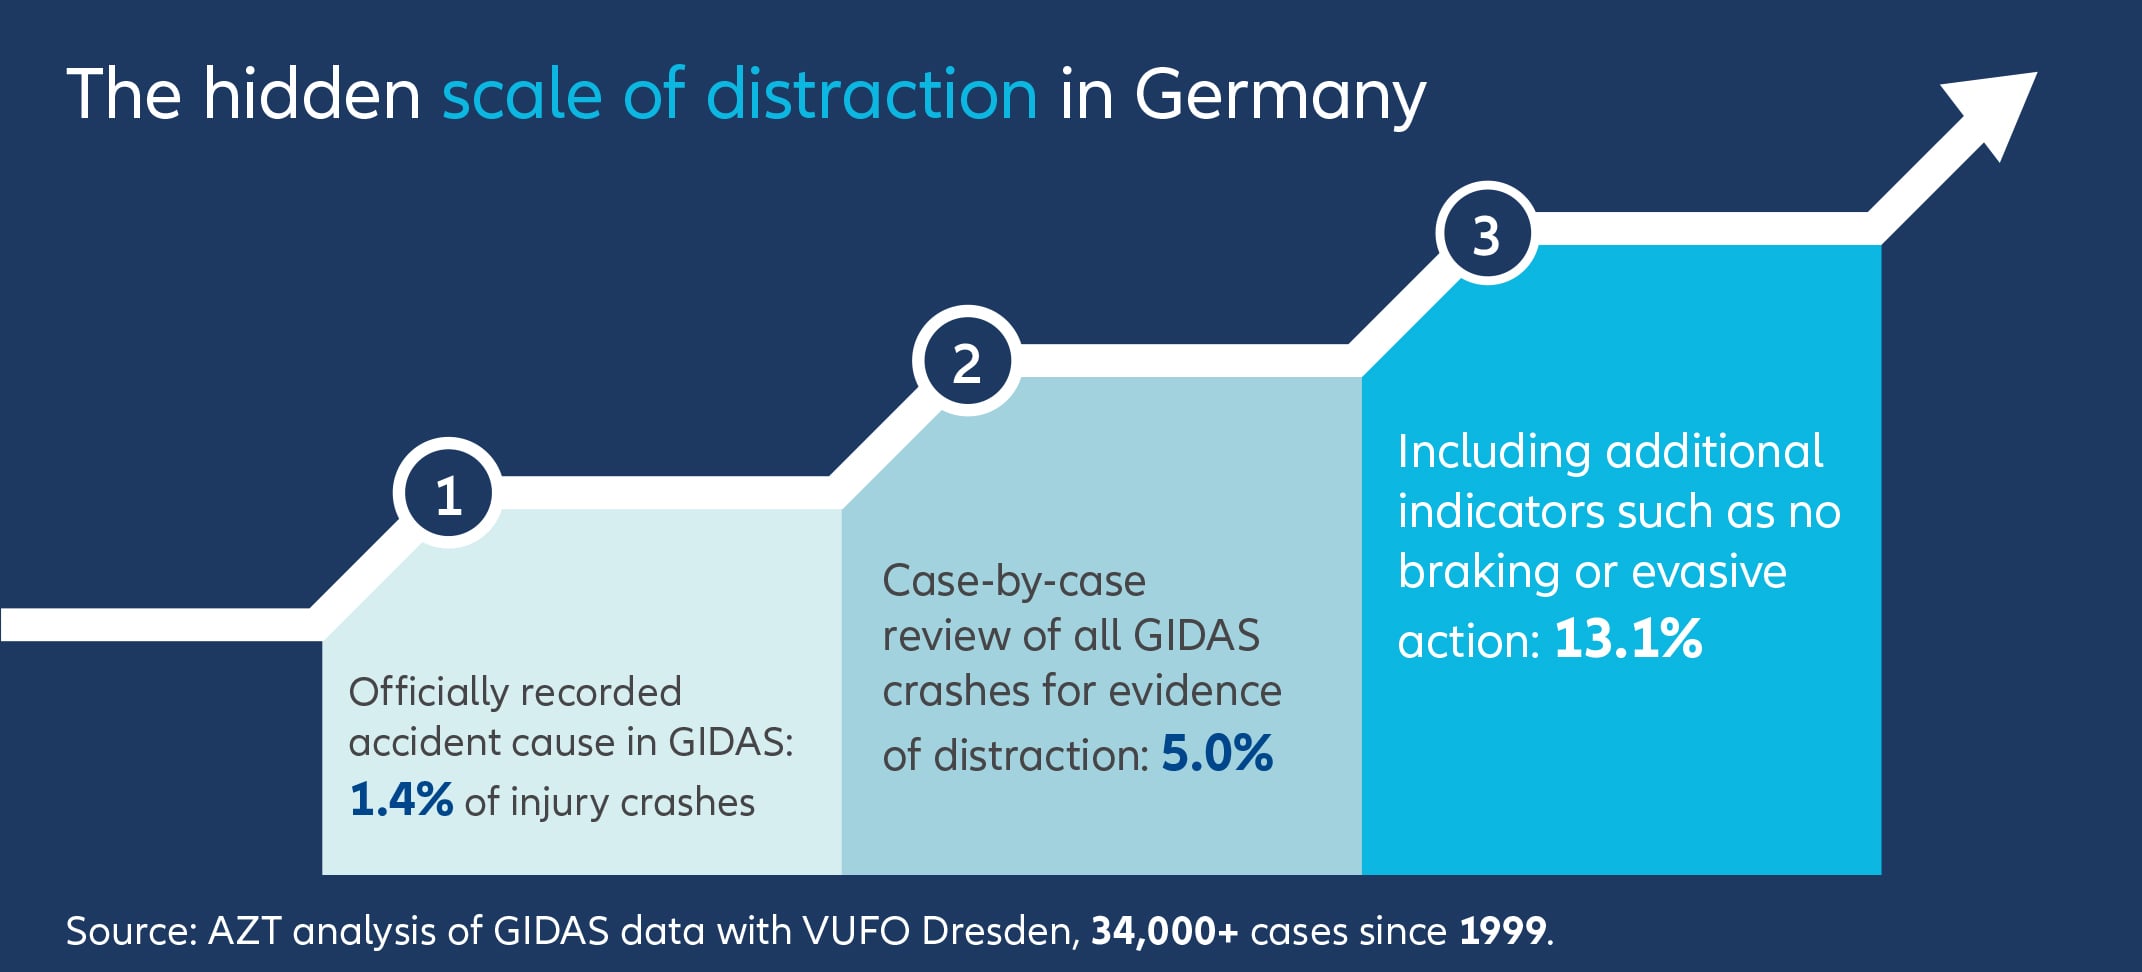
In the GIDAS data, distraction is officially recorded as a cause in only about 1.4 percent of injury crashes — a figure that comes from this same in-depth analysis, not from a separate police statistic. Read the same crashes case by case, looking past the recorded cause to the circumstances of each, and clear evidence of distraction appears in around 5 percent. Add further indicators — the behavior, the absence of any braking or evasive action — and it can point to a possible share of distraction of up to 13%. Even that is likely to be conservative, because distraction so often leaves no trace to find.
The database also shows who and where. Young drivers aged 18 to 25 and older drivers over 65 are over-represented in distraction-related crashes. These crashes happen more often outside towns, on the open roads where speeds are higher and the margin for a late reaction is smaller. Rear-end collisions and single-vehicle loss-of-control crashes dominate. And in distraction cases, the driver more often does not react at all — no brake, no swerve — which is the signature of eyes that were somewhere else.

From 2025
Hybrid Interaction Concepts
Hybrid Interaction Concepts
- Large displays remain
- Key functions regain physical controls
- Voice interaction and AI complement touch interfaces

From 2023
Recognition Phase
Recognition Phase
- Growing criticism of touch-only interfaces
- Concerns about distraction and usability
- Euro NCAP encourages directly accessible controls

2018-2023
Touch-First Era
Touch-First Era
- Fewer physical controls
- Climate controls move to the touchscreen
- Large widescreen displays
- Software becomes the primary interface

2012-2018
Touchscreen revolution
Touchscreen revolution
- Influence of smartphones
- Large capacitive displays
- Tesla as a role model
- Integration of Apple Carplay and Android Auto

Until 2012
Classic Controls
Classic Controls
- Many physical buttons
- Rotary knobs and switches
- Dedicated functions
- Small displays
Real-vehicle testing: the same task can demand substantially more attention in one car than another
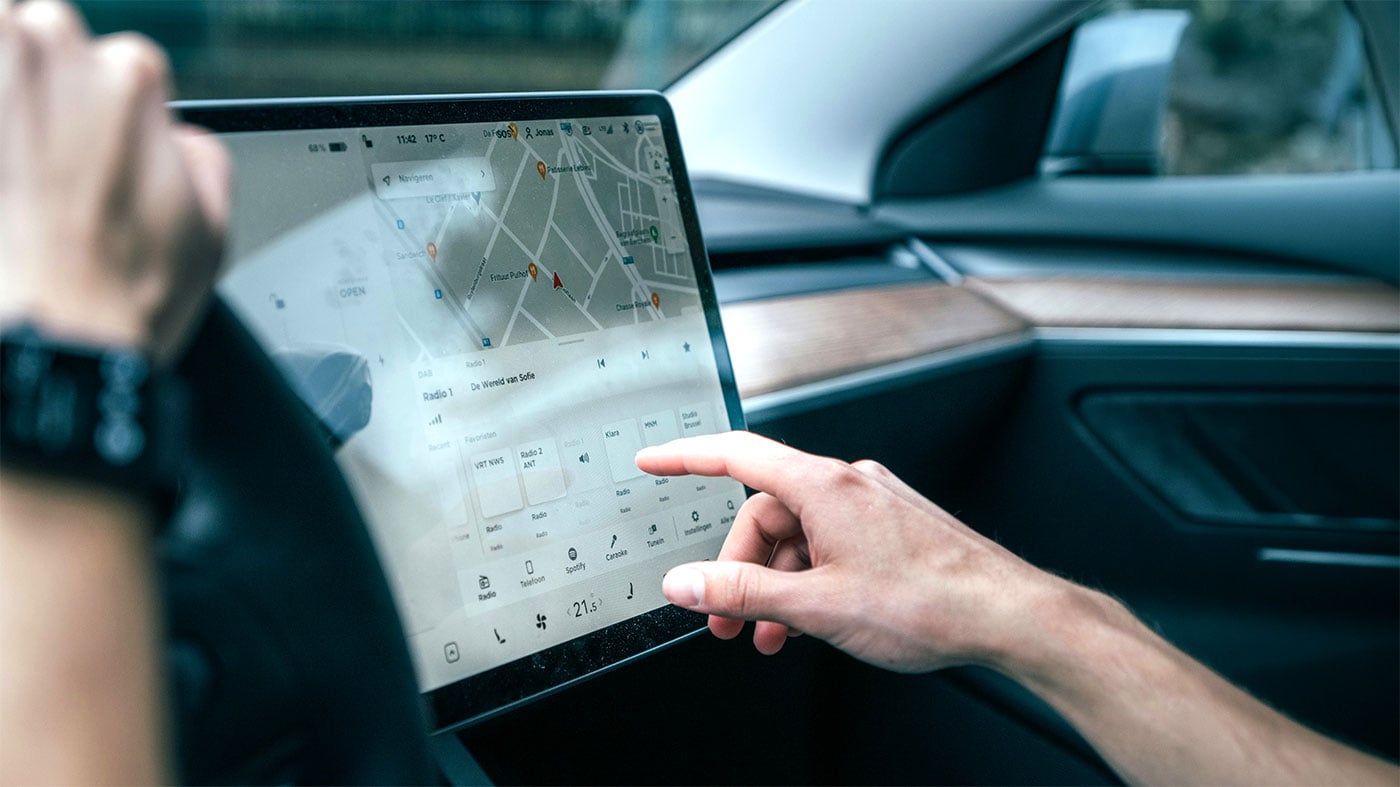
If distraction were only about the driver, the same task would carry the same risk in every car. It does not. In a real-vehicle study, the AZT had 20 drivers per car run identical everyday tasks — entering a destination, choosing a song — in two current electric compacts, on a country road, while an eye-tracker measured how long their eyes left the road.
Overall, total glance time was up to 25 percent lower with the more efficient interface — a difference of roughly three seconds. That difference did not come from a better or faster driver; it came from the interface. Consistent menus across functions, controls placed where the hand expects them, a system that responds without lag, familiar navigation and sensibly sized touch areas all shortened the time drivers spent looking away. In an emergency, three seconds is not a detail. It can be the distance between staying in control and a collision.
How a driver interacts matters as much as where the controls sit. In a driving-simulator study with the Technical University of Munich, the AZT compared basic touch interactions and found they are not equally demanding. Typing pulls the eyes away the most; drag-and-drop takes the longest to complete; a simple swipe or a pinch-to-zoom is far less costly. The lesson is not that touch is unsafe, but that different touch interactions impose very different levels of visual demand. Complex interactions should therefore be avoided or restricted while driving. Every strand of the work points the same way: the problem lies in poor interaction design, not in touchscreens themselves.
Cognitive modeling: a two-second glance can be more dangerous than driving while impaired by alcohol
To turn glance behavior into risk, the AZT worked for the first time with the modeling firm Cognibit, using a cognitive driver model calibrated with real gaze data from the vehicle study. The model simulates how drivers perceive, decide and react, and it ran four critical situations for attentive, distracted and intoxicated drivers (the last at 0.8 per mille blood alcohol). The scenarios were steady driving on a rural road with oncoming traffic, a sudden emergency braking ahead on the motorway, a forced lane change past a stationary obstacle and a child running onto the road in town.
When the car ahead braked hard on the motorway, the share of runs ending in a collision rose from 18.2 percent for attentive drivers to 54.3 percent for distracted ones. Safety margins collapsed with it: the minimum time-to-collision fell from 1.61 to 0.74 seconds, the minimum gap from 6.9 to 3.1 meters. When a child ran into the road, the collision share climbed from 3.9 to 11.2 percent — and in 39 percent of those distracted collisions the driver did not react to the child at all.
The rural road produced the starkest comparison. Distracted drivers drifted across the center line and into oncoming traffic in 5.4 percent of runs. Attentive drivers never did — and neither did the drivers modeled at over the drink-drive limit. In this situation, distraction proved more dangerous than alcohol. Across the four modeled situations, the distracted driver came off worse than the one over the drink-drive limit in all four of them. The forced lane change told the same story in a quieter register: distracted drivers failed the maneuver more often or cut their margins finer, with more of them dropping below a 1.5-second time-to-collision.
Behind these numbers is a pattern that matters. Danger does not build gradually with time spent looking away. The literature shows a clear pattern: crash and near-crash risk increases substantially as individual glances away from the road become longer. Glances exceeding around two seconds are consistently associated with elevated risk. Below it, the driver usually recovers. Above it, the road has moved on.
Automation is coming – attention must bridge the gap until it arrives
Automation is part of the answer over time. The AZT expects road accidents in Europe to fall by around 20 percent by 2035 and by more than 50 percent from 2060, as more capable systems take on more driving tasks. But two cautions hold. First, for decades the roads will carry a mix of conventional and automated vehicles — the mixed traffic environment in which human drivers remain responsible for most of what happens.
Second, automation brings distractions of its own: over-trust, drifting attention and out-of-the-loop effects, where a driver who has stopped actively driving struggles to re-engage when the system hands back control. Reducing risk is not the same as removing responsibility.

Dr. Christian Sahr
Managing Director of the Allianz Center for Technology (AZT)
"To ensure safe vehicle operation, clear recommendations are needed on which functions should be controlled via physical switches and which via touchscreen. At the same time, scientific insights into human-machine interaction should be applied consistently to design touchscreen interfaces that distract drivers as little as possible from the road."