- After resilient performance in the first half of 2022, global trade deteriorated in the second half of the year and is likely to remain muted in 2023. However, China’s reopening reduces the risk of sudden stops in global supply chains, while moderately supporting global demand.
- We are revising slightly on the upside our forecast for global trade growth in volume in 2023, from +0.7% to +0.9%. Price effects should still be negative, resulting in a yearly contraction of global trade in value terms in 2023.
- For inventory management and supply chains, lessons have been learnt from the Covid-19 and post-Covid shortages. In fact, oversupply is likely to prevail in 2023 amid weakening demand, replenished inventories, increased capex and normalizing shipping conditions.
- Today’s oversupply has also been exacerbated by the expansion of ocean carriers’ fleets in 2022 (+4% y/y in number of vessels) using the excess cash generated by record-high shipping rates in 2021. In this environment, shipping costs are returning to their pre-pandemic levels.
- While cyclical conditions reduced supply-chain disruptions, we are not fully rid of the risk of shortages, given a widening trade finance gap, the need for better and more infrastructure and geopolitical tensions.
In Focus
The silver lining amid muted global trade: normalizing supply chains
Market Movers
- Nigeria – Beyond the election transition. As Nigeria heads to the polls on 25 February, economic headwinds are intensifying. The next government will need to address falling purchasing power and demonstrate how the continent’s largest economy will keep up with the societal and green transitions.
- Eurozone mortgages – Looking forward to the ECB pivot. Households are shifting to variable-rate mortgages, hoping for a quick return to lower interest rates. The first effects of higher borrowing costs are emerging.
- China – The reopening is going well but don’t get too excited yet. Mobility has shot up in cities but other indicators suggest that all is not back to normal yet.
Nigeria – Beyond the election transition
As Nigeria heads to the polls on 25 February, economic headwinds are intensifying. Unlike other commodity exporters, Africa’s largest oil producer did not benefit from the surge in oil prices in 2022. As continued security issues shut down wells and attacks on infrastructure curtailed flows, output slumped by -32% in the first nine months of the year, remaining well below the OPEC production quota. To add to this, Nigeria’s costly fuel subsidies widened the fiscal deficit further (Nigeria ranks 9th in the world for the lowest gasoline prices), and usable foreign exchange reserves fell to less than six months of imports.
Figure 1: Nigeria’s gross international reserves and crude oil price
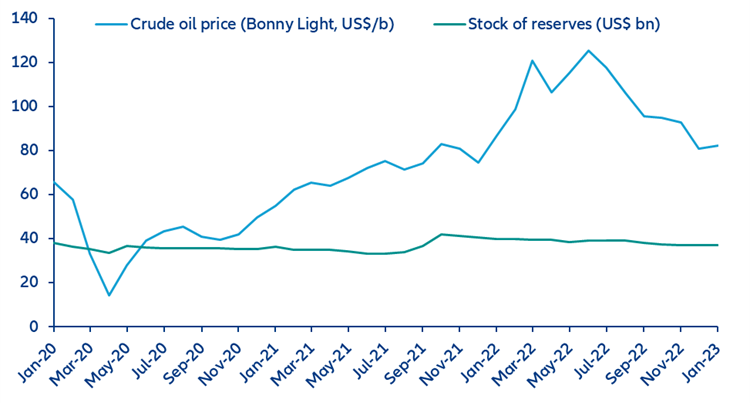
Sources: Central Bank of Nigeria, OPEC, Allianz Research
Investors are bracing for a heavy devaluation of the naira after the elections. Foreign portfolio participation in Nigerian stock trading fell to 16% in December 2022, from 49% before the pandemic. As of mid-February, the naira trades at NGN750 per USD1 on the parallel FX market – 63% lower than the official rate and compared to a 36% differential one year ago. To stabilize inflation and collect cash, the central bank introduced a naira redesign policy to replace the higher-denomination N200 (USD0.43), N500 (USD1.09) and N1000 (USD2.17) notes. However, the deadline for the note swap was postponed to mid-February and ultimately suspended due to shortages of the new notes in Nigerian banks and increasing attacks on branches and staff by clients. In the event of a heavy devaluation after the elections, the economy could face an even worse cost-of-living crisis.
Figure 2: Local currency exchange rates against USD
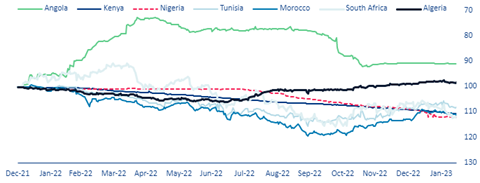
Sources: Macrobond, Allianz Research
Figure 3: Official rate of Nigerian naira and parallel rate against USD
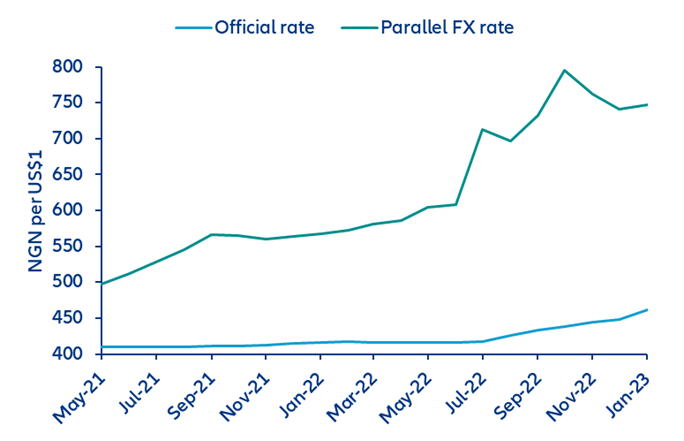
Source: CBN, Nigeria Galleria, Aboki FX, Allianz Research
The next government will need to address falling purchasing power to temper the risk of further social unrest, as well as future-proof the economy amid the global green energy transition. With flood-related destruction in 34 of the 36 Nigerian states in Q3 2022 and inflation stuck above 20% in Q4, social unrest and violence remain significant risks. In January alone, Nigeria witnessed 280 reported events that caused more than 900 fatalities. In the medium term, Nigeria’s economy faces a very real risk from the global energy transition, which could cut the oil revenues of African states by a quarter in the next seven years, according to the International Monetary Fund. Kick-starting the long-awaited refinery and additional LNG capacity could help generate efficiency gains, but a structural adjustment is even more essential.
Eurozone mortgages – Looking forward to the ECB pivot
The ECB’s rate hikes have led to a rapid tightening of financing conditions, causing loan growth to slow significantly. In particular, mortgage rates across the Eurozone have jumped since the beginning of 2022, following a historic low in 2021 (Figure 4). In Germany and Italy, rates soared by 215bps and 189bps, respectively, since January 2022, while France and Spain saw more contained increases (93bps and 148bps, respectively).
Figure 4: Annual growth of loans for house purchase vs. interest rate on new and outstanding housing loans
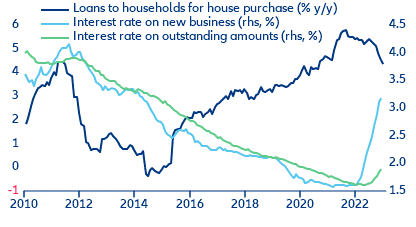
Sources: Refinitiv, Allianz Research
Recent lending trends suggest that Eurozone households are betting on a quick return to lower rates. Households flocked to fixed-rate mortgages in the era of low interest rates but now the share of new loans at variable rates has surged in some countries as households prefer not to “lock in” high interest rates (Figure 5). This is particularly evident in Italy, making households very sensitive to mortgage rates, which continue to increase. French borrowers are still securing housing loans at fixed (and lower) rates, given both national constraints that limit the ability of banks to pass on interest-rate rises to borrowers and a mortgage market geared towards fixed rates.
Figure 5: Cost of borrowing vs. share of loans at variable rate (%, new business)
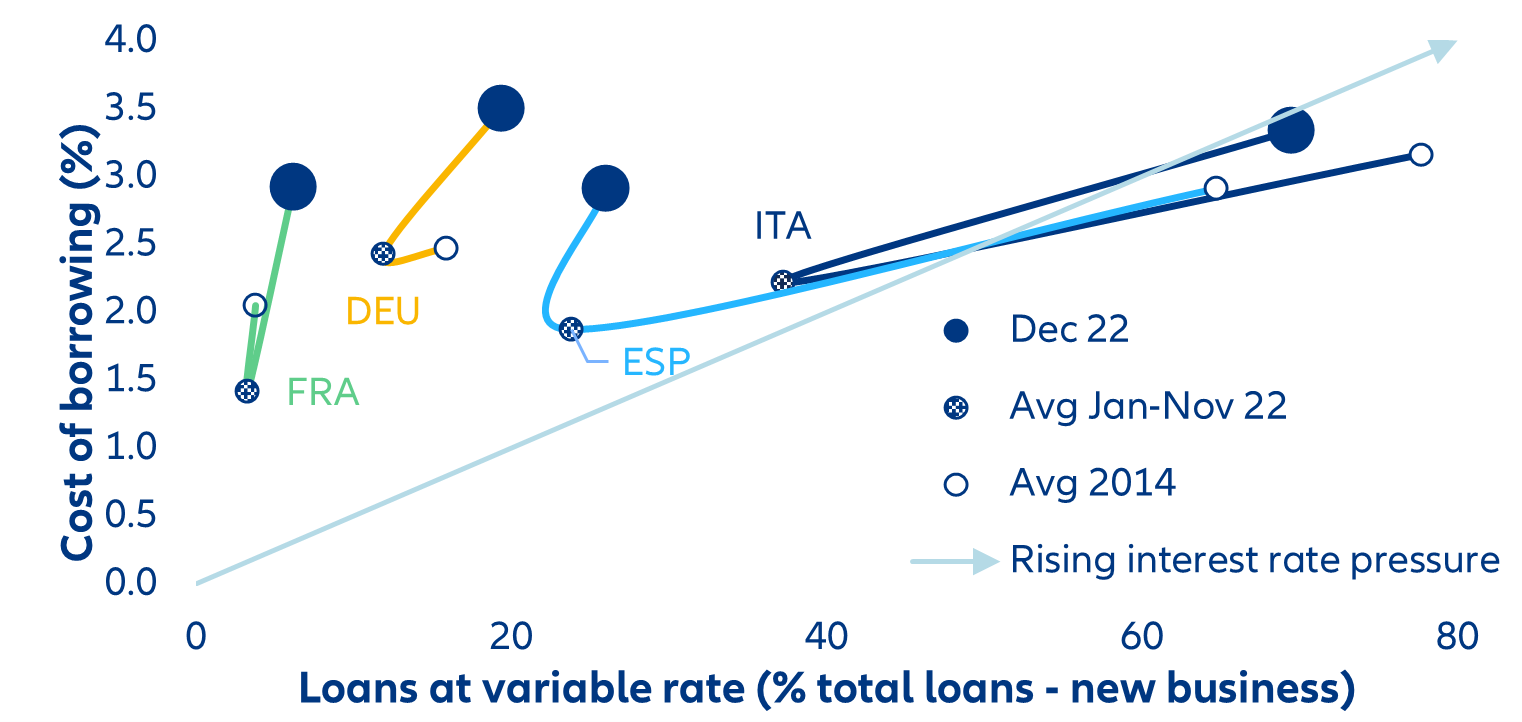
Sources: Refinitiv, ECB, Allianz Research
The structural shift to fixed exchange rates during the 2010s will help to partially cushion the impact of rising interest rates on house prices. Thus, a broad house price correction in Europe seems unavoidable, although it will differ in magnitude. We forecast accumulated real house-price declines of -3% in Spain and Italy, -5% in France and -8% in Germany in the next two years, compared to -15% in just one year in the US. Government support measures have mainly targeted the households that did not sign up for fixed-rate mortgages in the past, but these measures will only delay the impact. The longer interest rates remain high, the greater the threat to the sustainability of mortgage payments.
Below, we calculate the required decline in nominal house prices to compensate for the increase in interest rates to keep the total cost of purchasing a house equal (Table 1). Of course, this is a theoretical exercise in which we assume a perfect readjustment in the supply-demand equilibrium; in practice, a decline in the house price does not diminish the mortgage payment but rather reduces the relief from a forced sale.
Table 1: Correction in house prices needed to compensate for an interest rate shock so total housing purchase costs remain the same
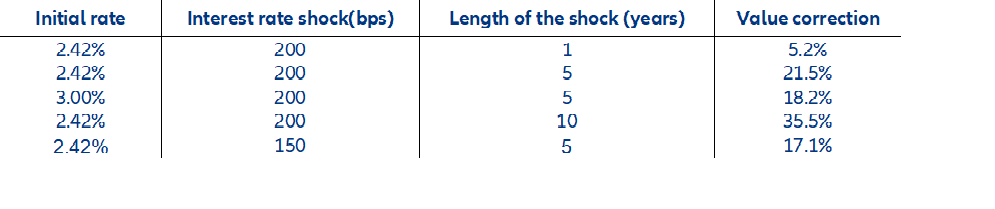
Source: Allianz Research. Main assumptions: Mortgage maturity of 15Y, loan to value constant for any price.
China – The reopening is going well, but don’t get too excited
The post-Covid reopening is going well so far, though things are not fully back to normal yet. More than a month since the faster-than-expected full relaxation of Covid-19 measures, and roughly one month before 2023’s first batch of hard macro data releases, we think it is a good moment to do a pulse check on how China’s post-Covid reopening is going. Mobility within cities has shot up quickly, exceeding last year’s and pre-pandemic levels in the past few weeks (see Figure 6). However, other measures suggest that all is not back to normal yet. Long-distance travel clearly improved from last year, but still remain less than half the volumes observed before the pandemic, while cross-border travels were less than 40% of the pre-pandemic level in early February. Overall, high-frequency indicators are all going in the right direction, and point to a rebound in private consumption in 2023.
[1] See Allianz Research quarterly economic and capital markets publication (link)
Figure 6: Traffic congestion index (population-weighted average of 100 cities), 100 = 30 days before Chinese New Year
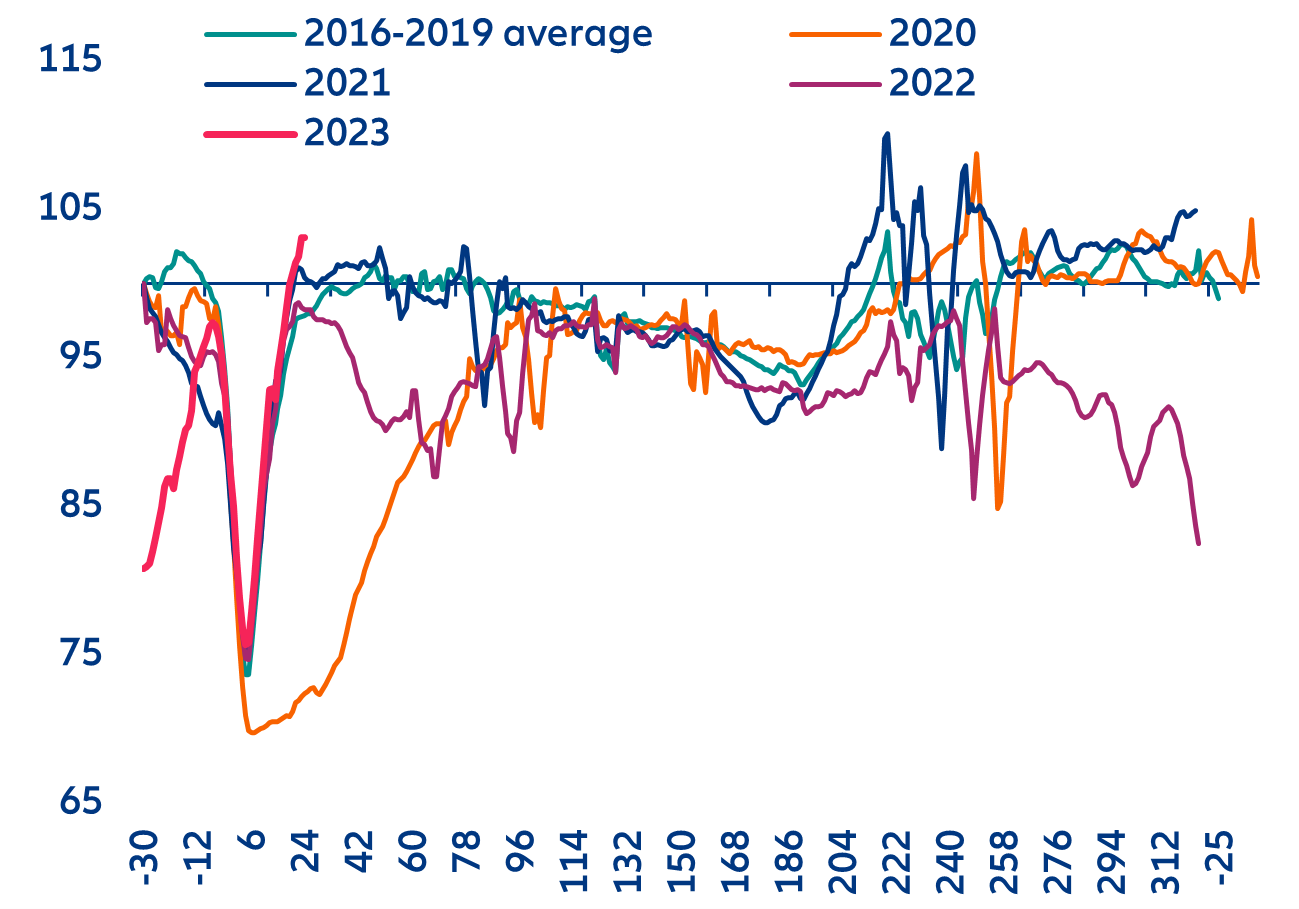
Sources: Macrobond, Allianz Research
A post-Covid rebound in private consumption is on the cards in 2023, but should be milder compared with 2021 or other countries’ experience. We expect private consumption to grow by +8.2% in 2023 (compared with +12.3% in 2021). On the positive side, improving confidence and a normalization of mobility support a normalization in household spending patterns. Furthermore, soft data already show improvements in the labor market (e.g. the recruitment index of the CKGSB survey, which improved for two consecutive months as of January 2023). However, the strength of the consumer rebound is mitigated by two main factors: 1/ excess savings are not as abundant as in other countries and 2/ the real estate sector will not experience a strong trend reversal. On the former factor, we estimate that Chinese households’ savings rate was on average 4pps higher than its pre-pandemic long-term average through 2020-2022 (see Figure 7). We estimate that this adds up to RMB3.4trn in excess savings, i.e. 2.7% of 2023 expected nominal GDP. This is low compared to other countries (e.g. as high as c.15% of GDP in some European countries). On the latter factor, the performance of the property sector (and in particular, housing prices) tends to affect household confidence as properties are the main component of households’ wealth.
Figure 7: Household survey and savings rate (%)
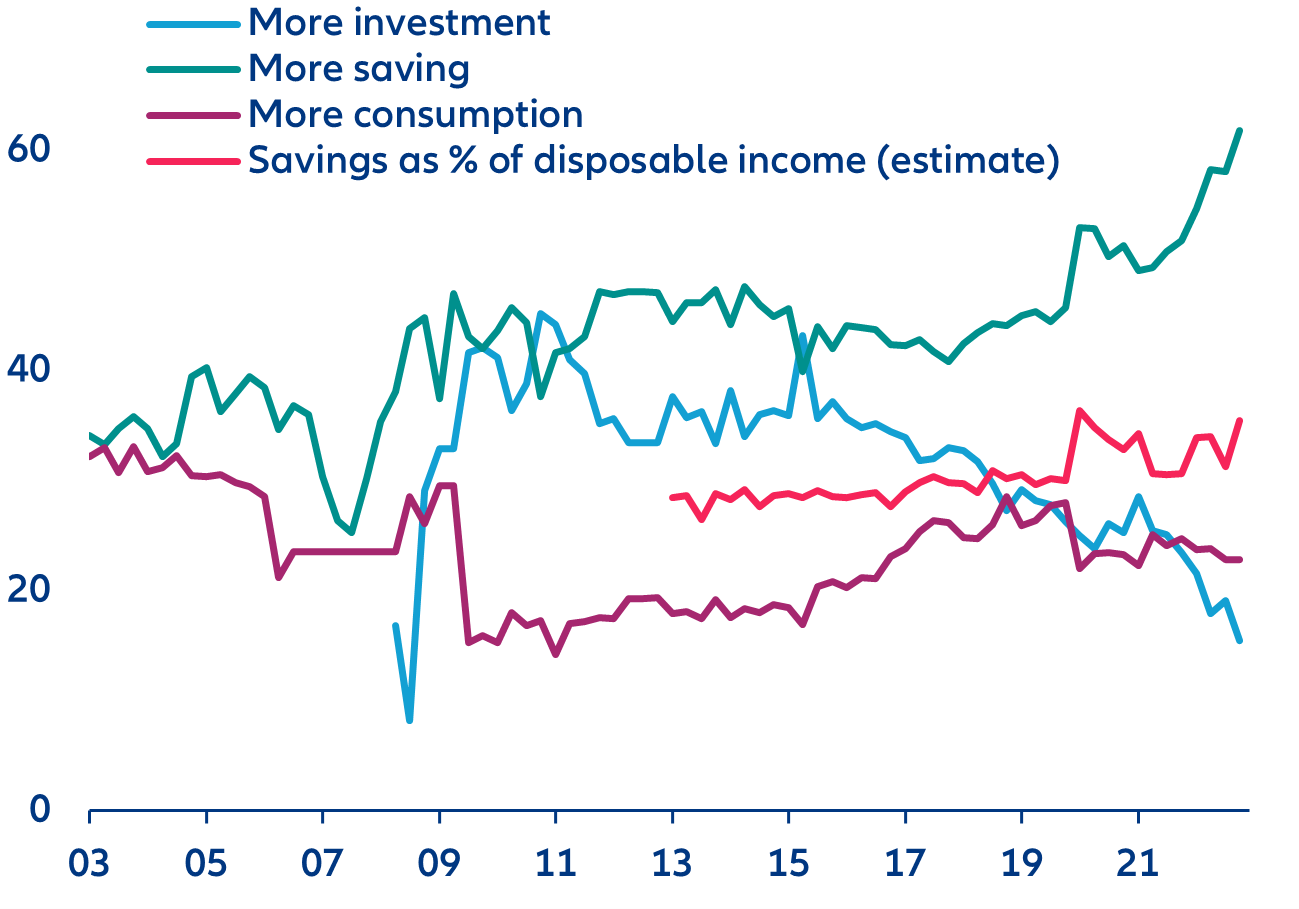
Sources: official sources, Allianz Research
Policymakers will do what is necessary to stabilize the real estate market – but don’t expect a strong trend reversal. Data released this week show the housing price index based on 70 cities stabilizing (at +0.1% m/m), after five consecutive months of sequential declines. This is consistent with recent policy moves, with regulators putting in place a mechanism that allows cities facing housing-price declines to set mortgage rates for first-time homebuyers below the official floors. While prices may be stabilizing, other data suggest that the amount of sales is still weak. High-frequency data show that transaction volumes in the 30 main cities declined by nearly -25% y/y so far in February. January credit data showed a deceleration in household medium-to-long term loans (which are mostly mortgages). Going forward, policymakers are likely to retain an accommodative stance to maintain a stabilization in housing prices, make sure that already begun construction projects can be brought to completion and avoid any systemic risk. That said, we do not foresee a strong trend reversal in the real estate sector, given that authorities likely aim for consolidation among developers, and their long-held stance is that “housing is for living in, not for speculation”.
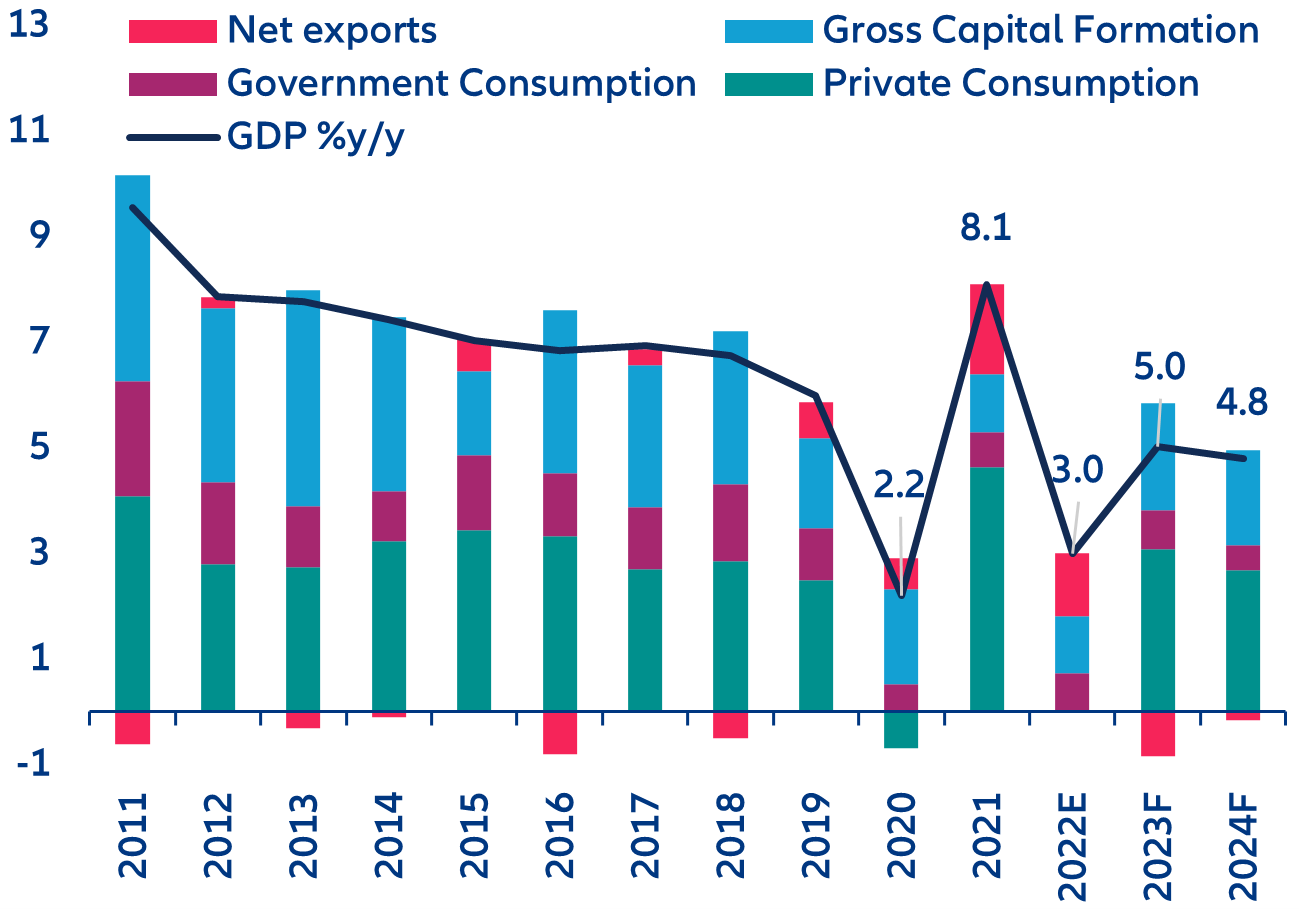
We expect the Chinese economy to grow by +5.0% in 2023 and +4.8% in 2023 (compared with consensus expectations at +5.2% and +5.0%, respectively) – see Figure 8. Net exports are likely to contribute negatively to overall growth in the context of slowing external demand (and improving imports). Private consumption will be the main positive driver, while an overall still accommodative policy stance should support investment. The kicking off of the annual “lianghui” parliamentary meetings in early March will provide more details into authorities’ plans for this year, with official economic targets for 2023 to be revealed on 5 March.
Figure 8: GDP growth (%) and contributions (pp)
Sources: official sources, Allianz Research
In focus – The silver lining amid muted global trade: normalizing supply chains
After resilient performance in the first half of 2022, global trade deteriorated in the second half of the year and is likely to remain muted in 2023. Despite disruptive events in H1 2022 (start of the war in Ukraine, long lockdowns in China etc.), global trade of goods grew by +4.1% y/y during that period (see Figure 9). However, weakening global demand amid sustained inflation, the long replacement cycles of durable goods and depleted excess savings have reversed the trend. From a supply and manufacturing perspective, while the situation differs from one sector to another, corporates generally show no signs of increasing stocks in the short-term. In fact, an inventory glut is visible, and particularly destructive for retailers. With most of these factors set to persist in 2023, trade growth is likely to remain muted this year.
Figure 9: Global trade of goods in volume terms (%y/y) and proxy for global demand-inventories mismatch
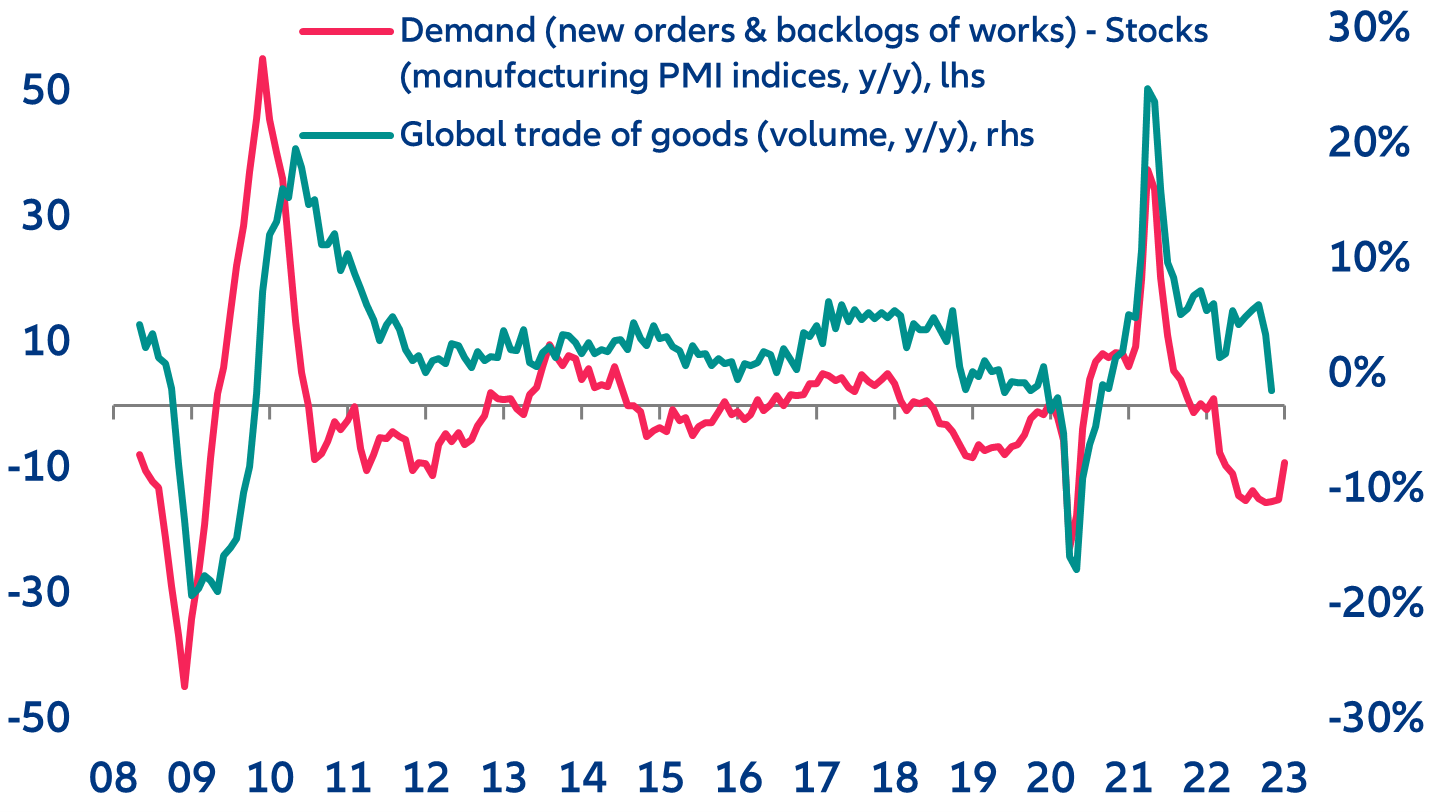
Sources: CPB, S&P Global, Allianz Research
However, China’s reopening reduces the risk of sudden stops in global supply chains, while supporting global demand (moderately). On the supply side, several critical intermediate goods are produced, transited and shipped out of China (and Asia). Normalizing domestic and port logistics bode well for global manufacturing-supplier delivery times, which are back towards the long-term average (see Figure 10). Maritime freight rates for routes from China to Europe and North America also mostly returned to their respective pre-pandemic levels at the beginning of this year.
Figure 10: China port congestion index and global manufacturing sector delivery times
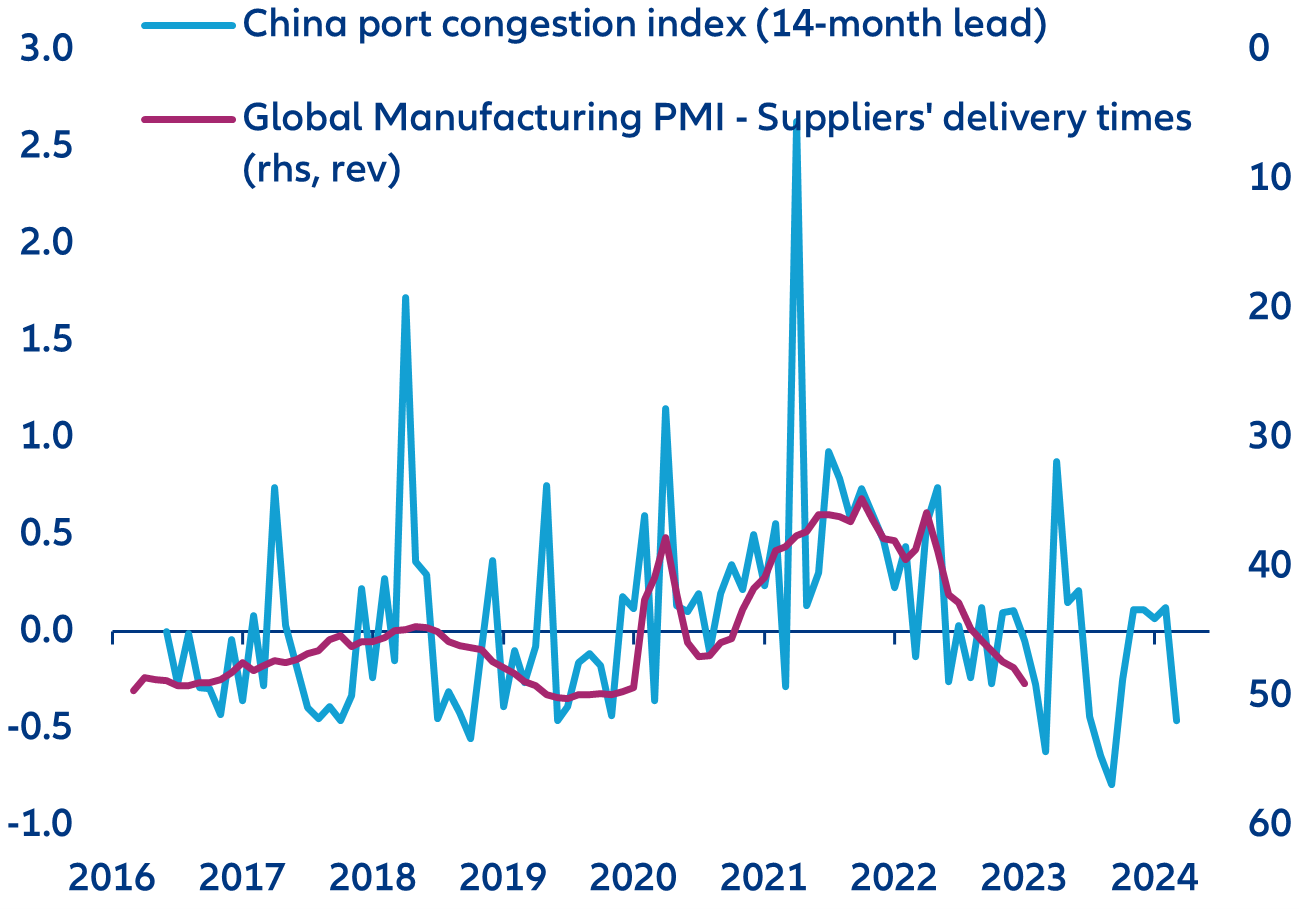
Note: The China port congestion index is a proprietary indicator we created based on port call data, using the four-day difference between exports and imports (the number of days a ship stays in ports on average), normalized with the average and standard deviation of the pre-crisis period (2015-19)
Sources: UNCTAD AIS database, S&P Global, Allianz Research
From a demand perspective, the more optimistic economic outlook for China implies an upwards revision of Chinese imports in 2023 by nearly USD80bn. In absolute terms, the exporters that will benefit the most from this increase are likely to be in Hong Kong (+USD13bn of additional export gains in 2023), the US (+USD6bn), South Korea (+USD5bn), Japan (+USD5bn) and Germany (+USD5bn) – see Figure 11.
Figure 11: Additional export gains (USD bn) from China’s reopening
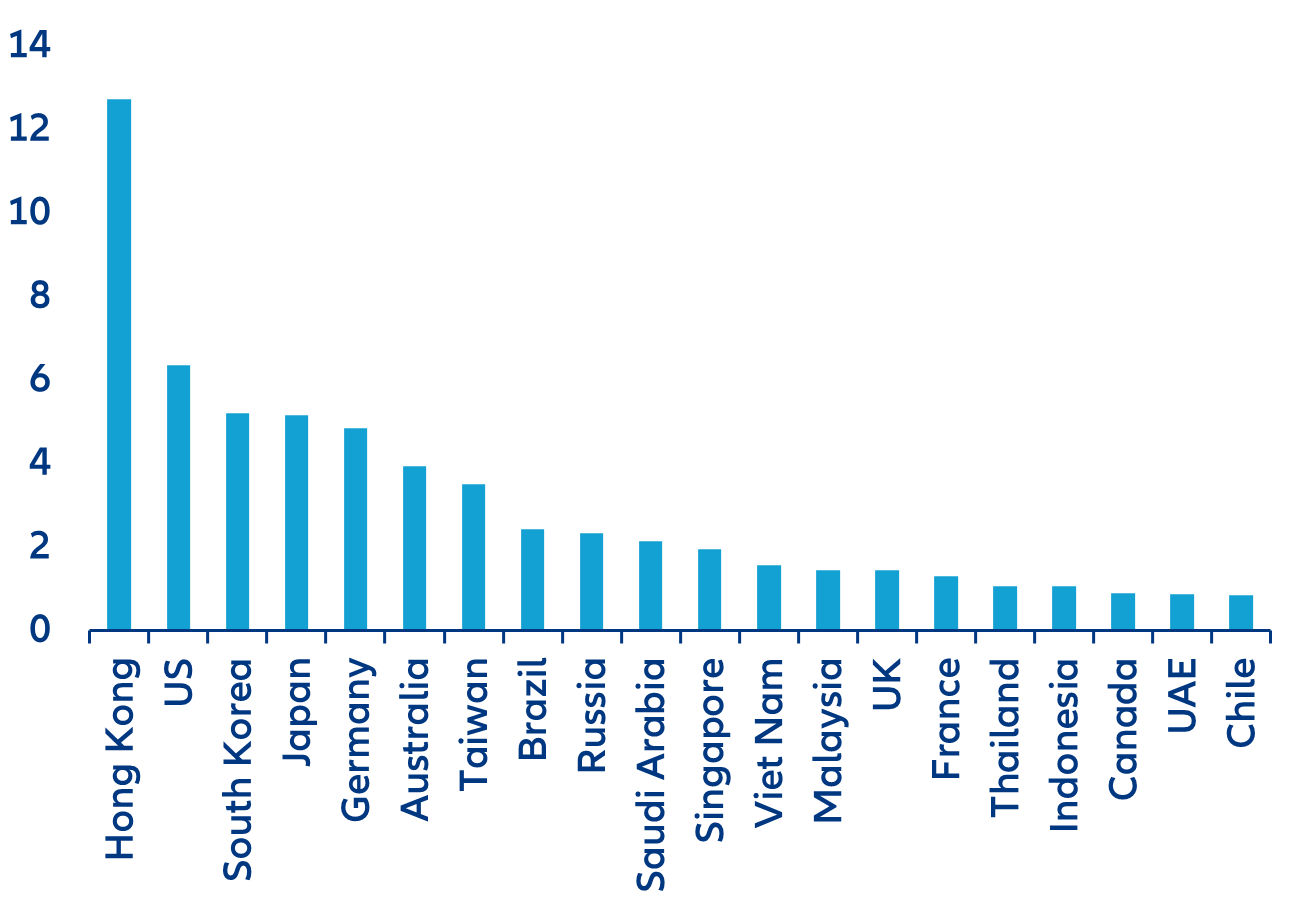
Source: Allianz Research
We are revising slightly on the upside our forecast for global trade growth in volume in 2023, from +0.7% to +0.9%. Our updated global trade model points to a quarterly profile of slight q/q contractions in global trade of goods and services in Q4 2022, Q1 and Q2 2023, before a moderate recovery in Q3 and somewhat of a firming up in Q4 (see Figure 12). Global trade of goods and services in 2024 is also slightly revised on the upside, expected to grow by +3.9% in volume terms (instead of +3.6% previously expected). We still expect price effects to be negative in 2023 (resulting in a yearly contraction of global trade in value terms) in the current context of a normalization in supply chains and the price of trade.
Figure 12: Global trade of goods and services, %q/q
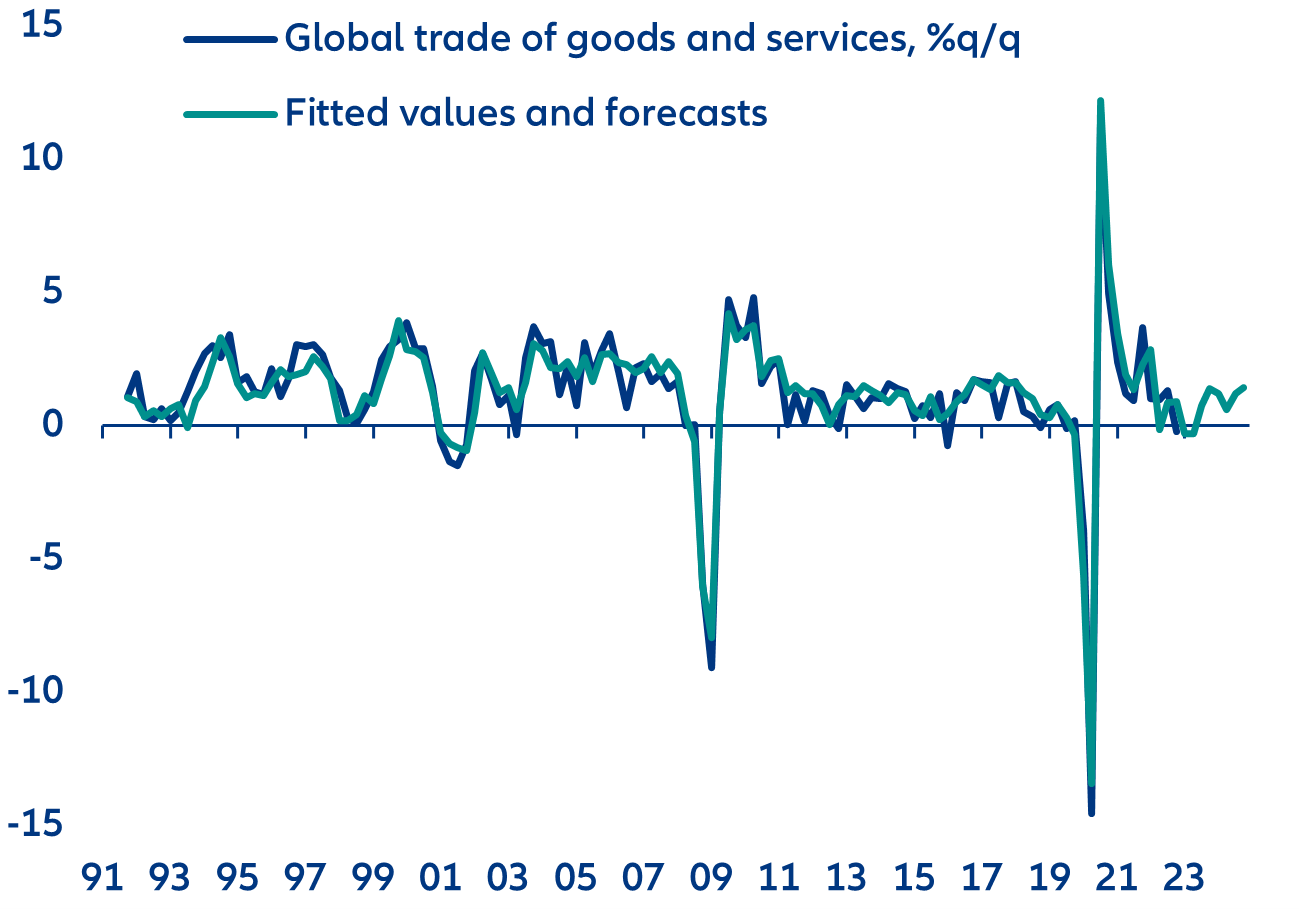
Source: Allianz Research
For inventory management and supply chains, lessons have been learnt from the Covid-19 and post-Covid shortages. Oversupply is likely to prevail in 2023. Destocking amidst the early stages of the Covid-19 crisis in 2020 and ensuing capacity mismatches and supply-chain disruptions into 2021-2022 have pushed more companies to adopt the just-in-case model of inventory management (instead of just-in-time). As a result, after more than a year of supply-chain disruptions illustrated by shortages of critical goods, extended transportation delays and costs of inputs shooting up, our in-house indicators tracking the global supply-demand balance suggest a situation of oversupply since Q4 2022 (see Figure 13). Our indicator measuring production shortfall reached the lowest level since 2011 in the US, and the lowest since early-2020 in the Eurozone. Ample supply and some stabilization in supply chains are likely to prevail this year on the back of weakening demand, replenished inventories, increased capex and normalizing shipping conditions (higher capacity, easing port congestion and sinking spot freight rates).
Figure 13: Supply vs. demand proxies, US and Eurozone
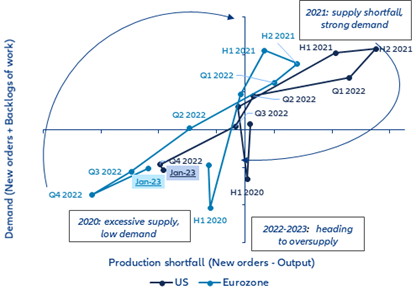
Sources: S&P Global, Allianz Research
Today’s oversupply has also been exacerbated by the expansion of ocean carriers’ fleets in 2022 (+4% y/y in number of vessels) using the excess cash generated by record-high shipping rates in 2021. At the time, limited capacity could not keep up with the pattern of post-pandemic overconsumption. Now, however, increased capacity has led to accelerated deliveries. Shipping companies already saw a contraction in the number of containers loaded in Q4 2022. They have also warned that they expect demand to remain weak in the first quarters of 2023 amid persistent inflation and companies’ need to dispose of existing inventories.
Figure 14: Global containerships volume capacity (number of vessels and fleet size)
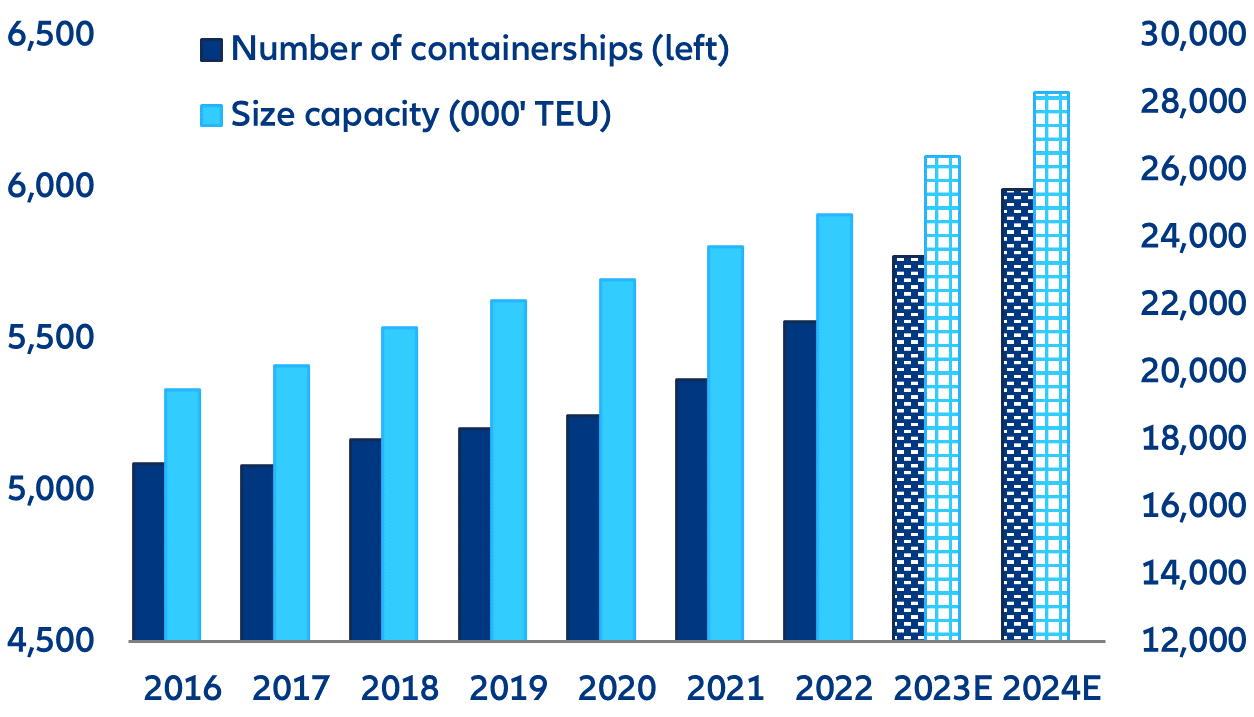
Sources: Refinitiv Eikon, Allianz Research.
In this context, shipping costs are nearing their pre-pandemic levels. At the beginning of 2023, the average spot price for maritime transportation was USD2,135/forty-foot box (-77% y/y) and by mid-February it fell to USD1,997/forty-foot box (see Figure 15, left panel) as a result of persistent recession fears that have halted new orders. Because almost 90% of traded goods are transported by sea, companies in the maritime industry are expecting a revenue contraction of -34% y/y in 2023 and -7% y/y in 2024, after two profitable years. The financials of the 15 largest players in the shipping sector show that revenues jumped by +78% y/y in 2021 (totaling USD305bn) while the preliminary data for 2022 indicates growth of +25% y/y, amounting up to USD380bn (see Figure 15, right panel).
Figures 15: Revenue evolution of ocean carriers (top) and average spot freight rates (below)
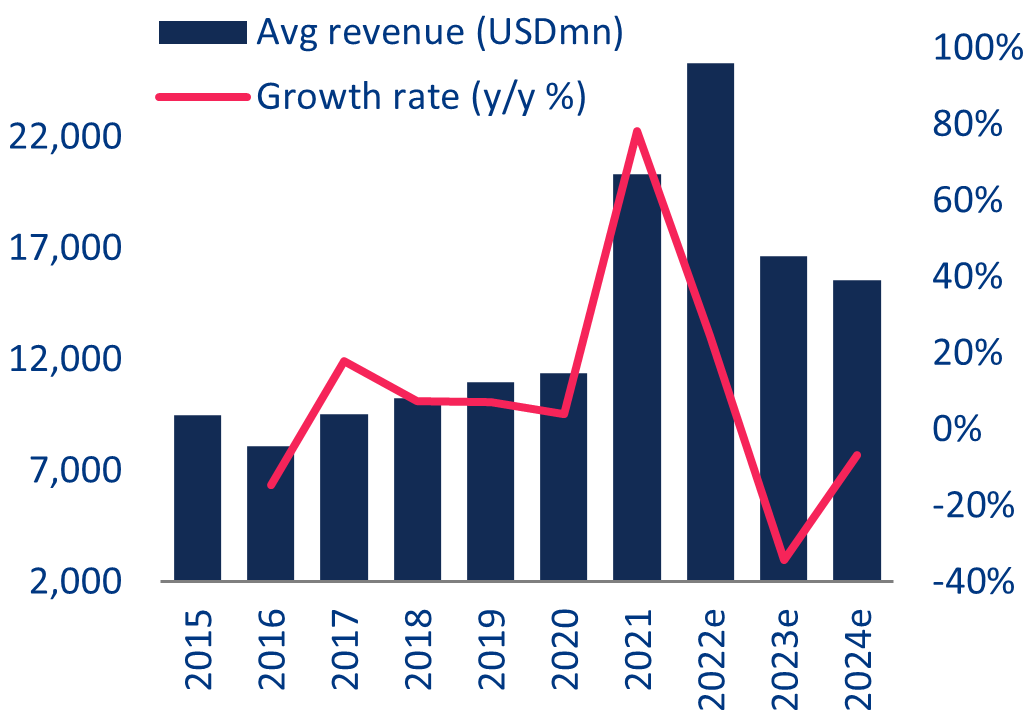
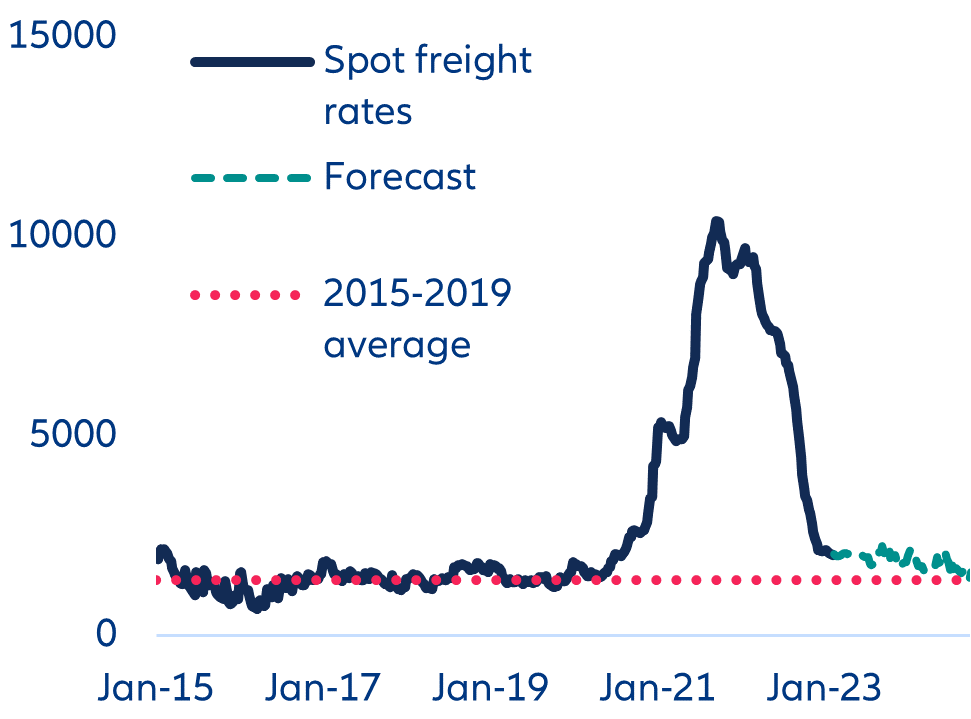
Sources: Refinitiv Eikon, Allianz Research.
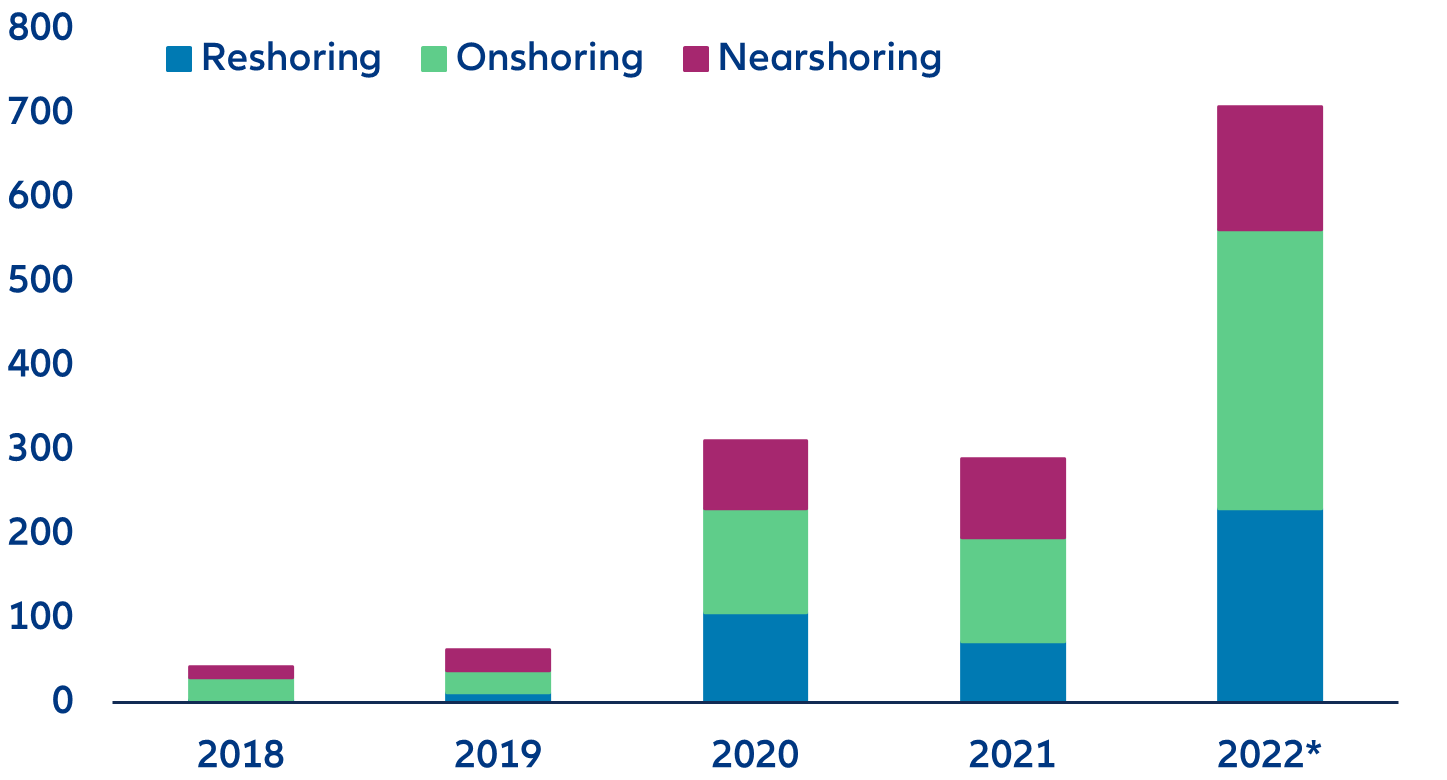
While cyclical conditions have reduced supply-chain disruptions, we are not fully rid of the risk of shortages. In the short-term, tightening funding conditions and rising interest rates are affecting companies and could potentially widen the trade finance gap (see Figure 16). This shortfall of funding means that some trade flows cannot materialize, potentially hindering the normal functioning of parts of supply chains. Another risk stems from infrastructure quality and availability[1]. After all, adding containers and ships without increasing the domestic infrastructure to load and unload them would still lead to congestions in shipping. The US planned USD17bn of additional spending on port infrastructure and waterways in late-2021, but the EU is still lacking a large-scale investment plan. Finally, geopolitical tensions could also be a source of shortages – as evidenced by the war in Ukraine. Trade tensions and protectionism can also affect the availability of traded goods (e.g. US ban on semiconductor exports to China, China’s ban on export of technology used to make solar panels etc.). Widely discussed trade patterns such as reshoring, nearshoring and onshoring (see Figure 17) could help in dissolving supply-chain bottlenecks, but they seem be more talk than walk and the large-scale feasibility can be questioned.
Figure 16: Trade finance gap
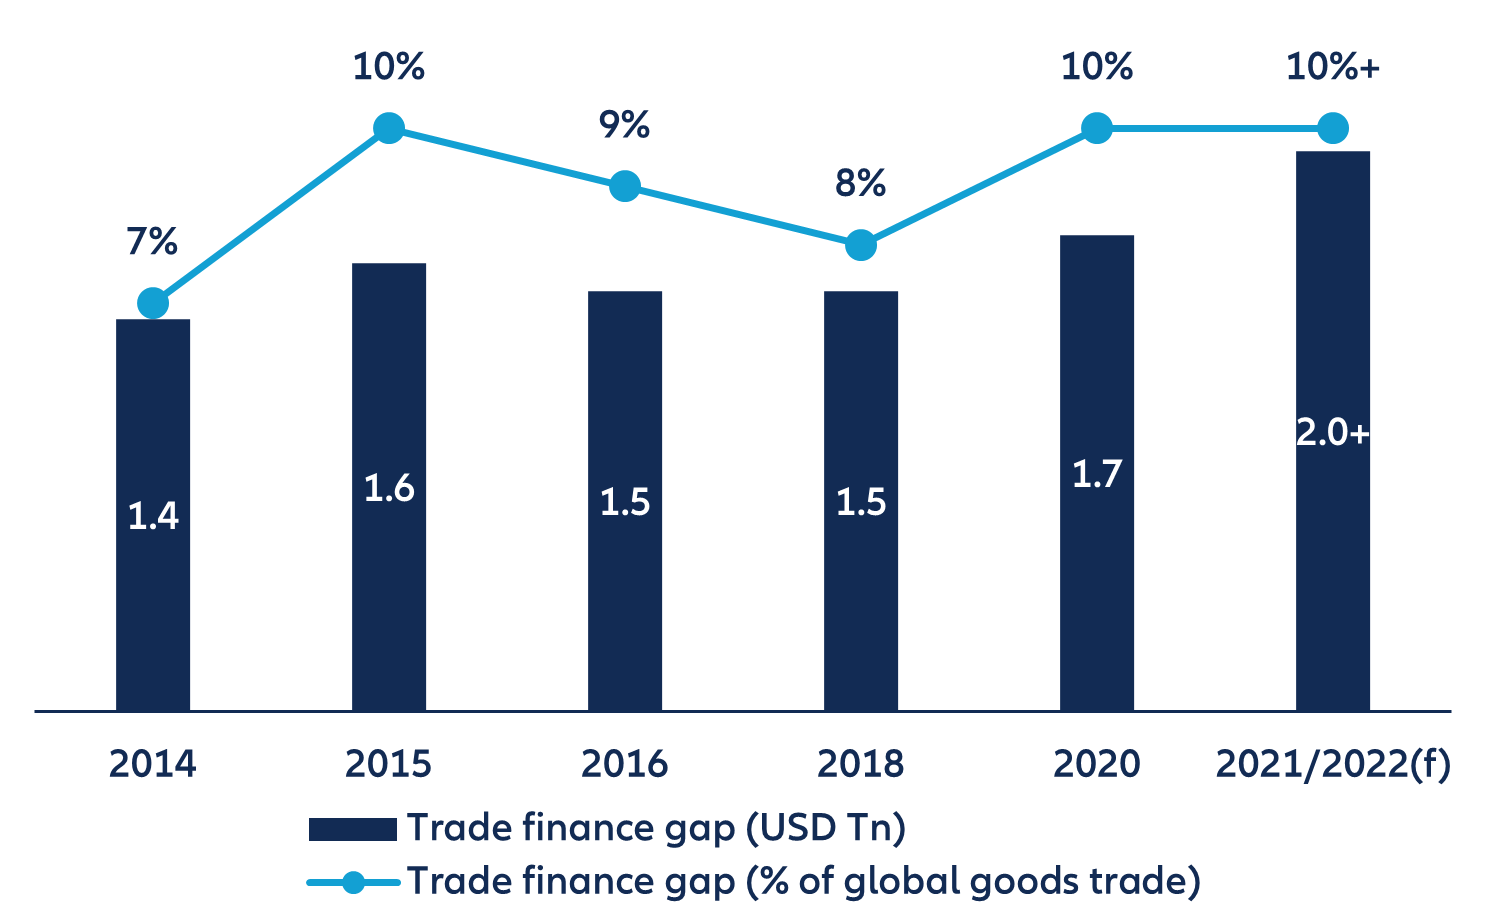
Source: ADB
Figure 16: Trade finance gap
Sources: IMF, Allianz Research. 2022: Preliminary data as of January 2023