- In a context of higher inflation and financial instability on the one hand, and a just transition and deglobalization on the other, the drivers of Return on Equity (RoE) across geographies help identify risks and opportunities in equity markets. The US (high leverage, low taxation) and Europe outside the Eurozone (high Return of Capital employed or RoC and low cost of debt) recorded the highest RoE at the end of 2022, as well as on average between 2007 and 2022. In contrast, we find the lowest RoE in Japan (low RoC, low EBITA margin) and the Eurozone (lowest sales-to-asset ratios).
- Except for Japan, increasing leverage has been the key driver of returns on equity, especially in the US. Except for the US, profitability (RoC and its spread over the cost of debt) has declined. Taxation has had a second order and opposite effect. The RoC has declined in all countries or regions, driven by a general decline in the sales-to-assets ratio. By reducing shareholders’ equity, share-buyback programs have also contributed to the recent rise in companies’ debt-to-equity ratios.
- Sector specialization affects capital intensity and funding needs. Similar cyclical (e.g. tighter financing conditions, slower growth) and structural (e.g. decarbonization, deglobalization) challenges could weigh further on economic performance through the return on capital employed. The technology services sector in the US (lowest capex and financing needs), the Eurozone’s consumer discretionary and industrials sectors (record leverage, low taxation) or the emerging world’s energy and upstream supply sectors (low RoC, limited leverage available) are good examples of increasing cyclical and structural vulnerabilities already largely offset by corporate finance tactics, and now more at risk.
What can companies’ RoE tell us about equity returns?
Equity returns, the market performance indicator, and Return on Equity, the accounting concept, are not independent of each other, neither theoretically, nor empirically. The Return on Equity (RoE) of a listed company is a financial performance ratio calculated by dividing the net profit of a company by its shareholders’ equity. First, stock markets do anticipate variations in RoE with a lead time of about two quarters. Second, stock markets with high RoEs tend to deliver higher equity returns than markets with low RoEs (Figure 1, opposite).
In a context of fresh cyclical and structural challenges – inflation and financial instability on
the one hand, climate mitigation and deglobalization on the other – identifying the drivers of
RoE around the world may help to identify risks and opportunities in equity markets.
We know that RoE increases with:
1. The return on capital employed (RoC). The RoC is the ratio of EBITDA (earnings before interest, taxes, depreciation and amortization) to total assets. It can be broken down into two intermediate ratios: the EBITDA margin (EBITDA-to-sales ratio), which is an indicator of economic profitability, and the ratio of sales-to-assets, which is a capital-intensity indicator.
2. The spread between the RoC and the cost of debt (Cod)
3. The company’s leverage level as measured by gross debt to shareholders’ equity.
… and decreases with:
4. The effective taxation rate.
Figure 1: Relationship between return on equity and equity returns
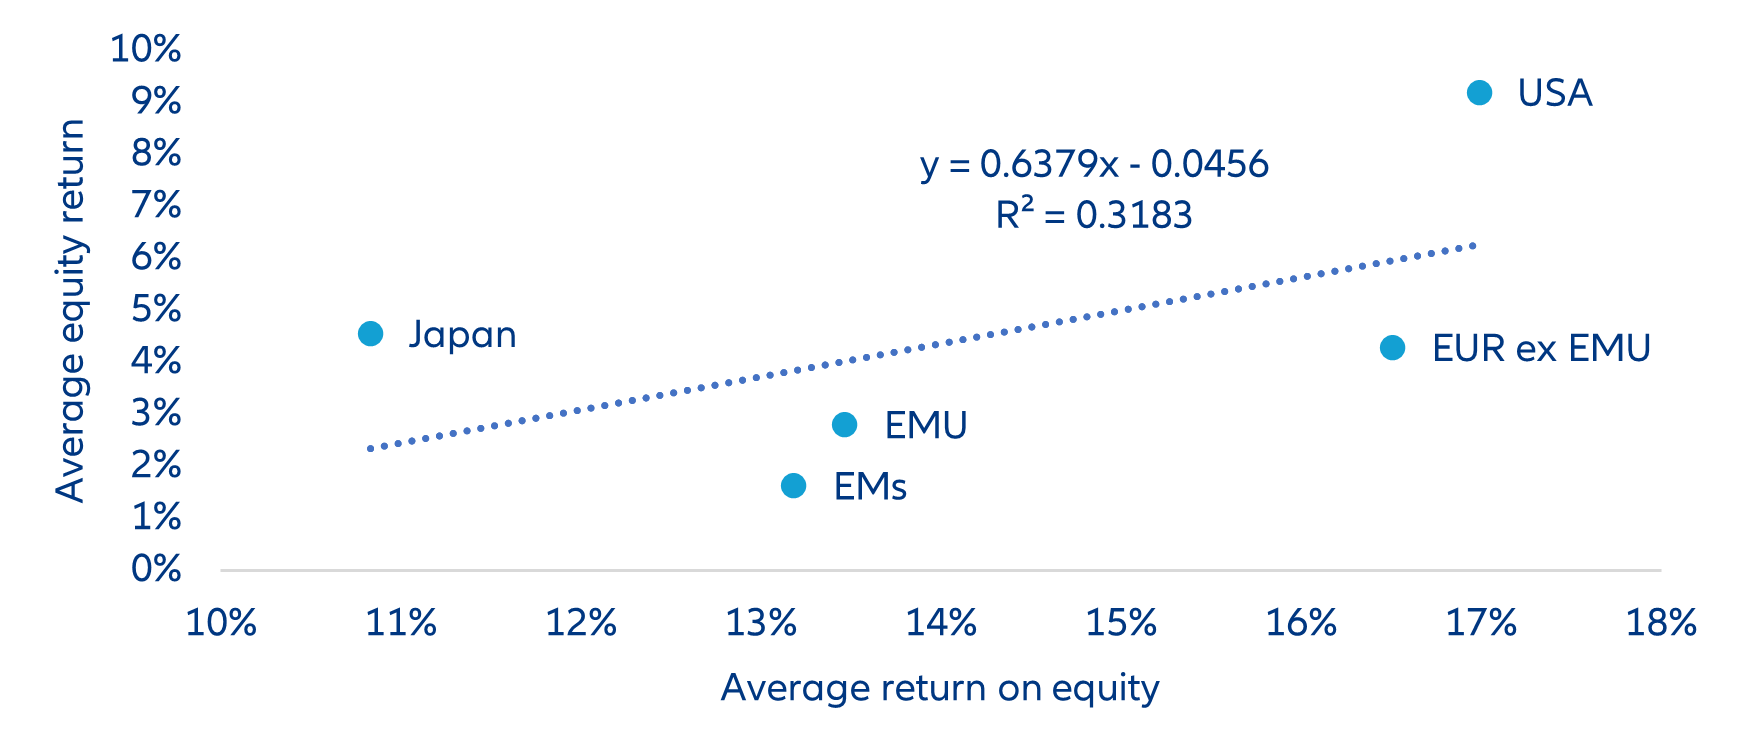
Sources: Refinitiv, Allianz Research; because of data limitations, the analysis is limited to NFCs.
In Table 1a and 1b, we compute these average financial ratios by stock markets (US, Eurozone or EUR, Europe outside of the Eurozone or EMU, Japan or JPN, and emerging markets or EM), and rank them. All financial ratios are in percentage. First position is given to the higher RoE, RoC, EBITDA margin, sales-to-assets, RoC-DoC and leverage, and the lower debt cost and tax rate. We decided to look at values at end of 2022 as well as the average between 2007 and 2022 to benchmark.
Table 1a – Ranking at the end of 2022
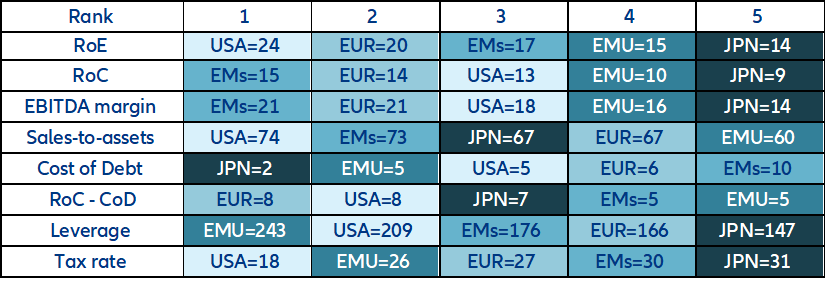
Table 1b – Ranking using the average between 2007 and 2022
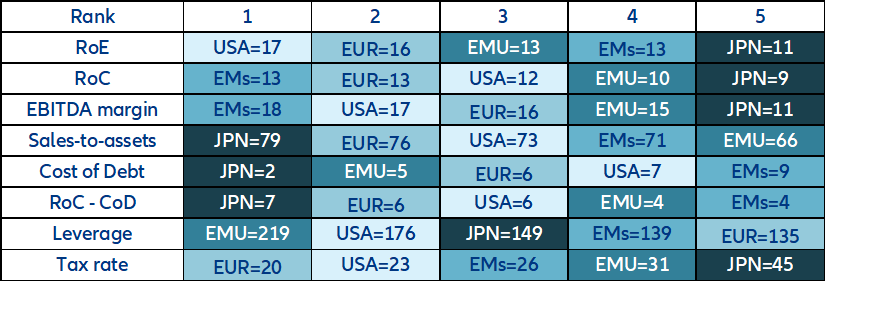
Sources for Table 1a and 1b: Refinitiv, Allianz Research
Unsurprisingly, the US shows the highest RoEs while Japan shows the lowest. In the US, RoC is median or slightly above average, like its EBITDA-to-sales and sales-to assets ratios, and the spread between its RoC and cost of debt. However, it combines high leverage with low taxation. Japan has the lowest RoE and the lowest RoC, with a particularly low EBITDA margin. This poor performance is offset by the lowest cost of debt, which contributes to the highest spread between the RoC and the cost of debt. However, low leverage and high taxation are diminishing this strength.
Eurozone companies show an average RoE, a below-average RoC and EBITDA-to-sales ratio and the lowest sales-to-assets ratio. However, Eurozone companies admittedly benefit from a low cost of debt, though not low enough to compensate for the low RoC. At the end of the period, Eurozone companies benefited from the second-lowest taxation rate, an improvement over the past. In the end, their leverage – the highest in our sample – saves the day. Corporates in Europe outside the Eurozone rank second in terms of RoE and RoC. They benefit from a low or below-average cost of debt, which contributes to an above-average spread between the RoC and the cost of debt. A low taxation rate rather than high leverage supports the RoE.
The RoE in EMs is average or below average, despite a strong performance in terms of RoC, led by the highest EBITDA margin. However, this strength is offset by the highest cost of debt in our sample. Low or below-average leverage alongside high or above-average taxation also weighs on the RoE.
Over the 2007-2022 period, the highest dispersion among companies is observed for the cost of debt, followed by the effective taxation rate, the spread between the RoC and the cost of debt, leverage and finally the RoC. In Figures 2a and 2b, the RoE and its drivers are rescaled relative to the highest value in the sample so as to highlight their dispersion, first at the end of 2022 and second on average between 2007 and 2022. This hierarchy is not fundamentally altered at the end of the period, except for the effective taxation rates, the dispersion of which has decreased. In other words, it is not economic performance proper that explains differences in RoE but rather corporate finance decisions and financial engineering.
Figure 2a – Rescaled drivers of the return on equity at the end of 2022
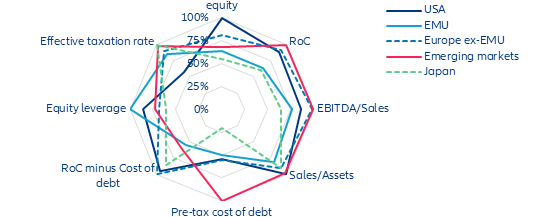
Sources: Refinitiv, Allianz Research
Figure 2b – Rescaled drivers of the return on equity: average 2007-2022
Sources: Refinitiv, Allianz Research
The most striking development is the worldwide decline in the sales-to-assets ratio between 2007 and 2020 (Figure 3). This ratio relates a flow, evaluated at current prices, to a stock, evaluated
at historic cost (i.e. an average of past prices). As such, this ratio may reflect the way inflation impacts investment decisions in the corporate sector. As regards financial engineering, the most striking development is the rise of leverage in almost every region (except in Japan), particularly in EMs (Figure 4, opposite).
at historic cost (i.e. an average of past prices). As such, this ratio may reflect the way inflation impacts investment decisions in the corporate sector. As regards financial engineering, the most striking development is the rise of leverage in almost every region (except in Japan), particularly in EMs (Figure 4, opposite).
Figure 3 – Sales-to-assets ratio
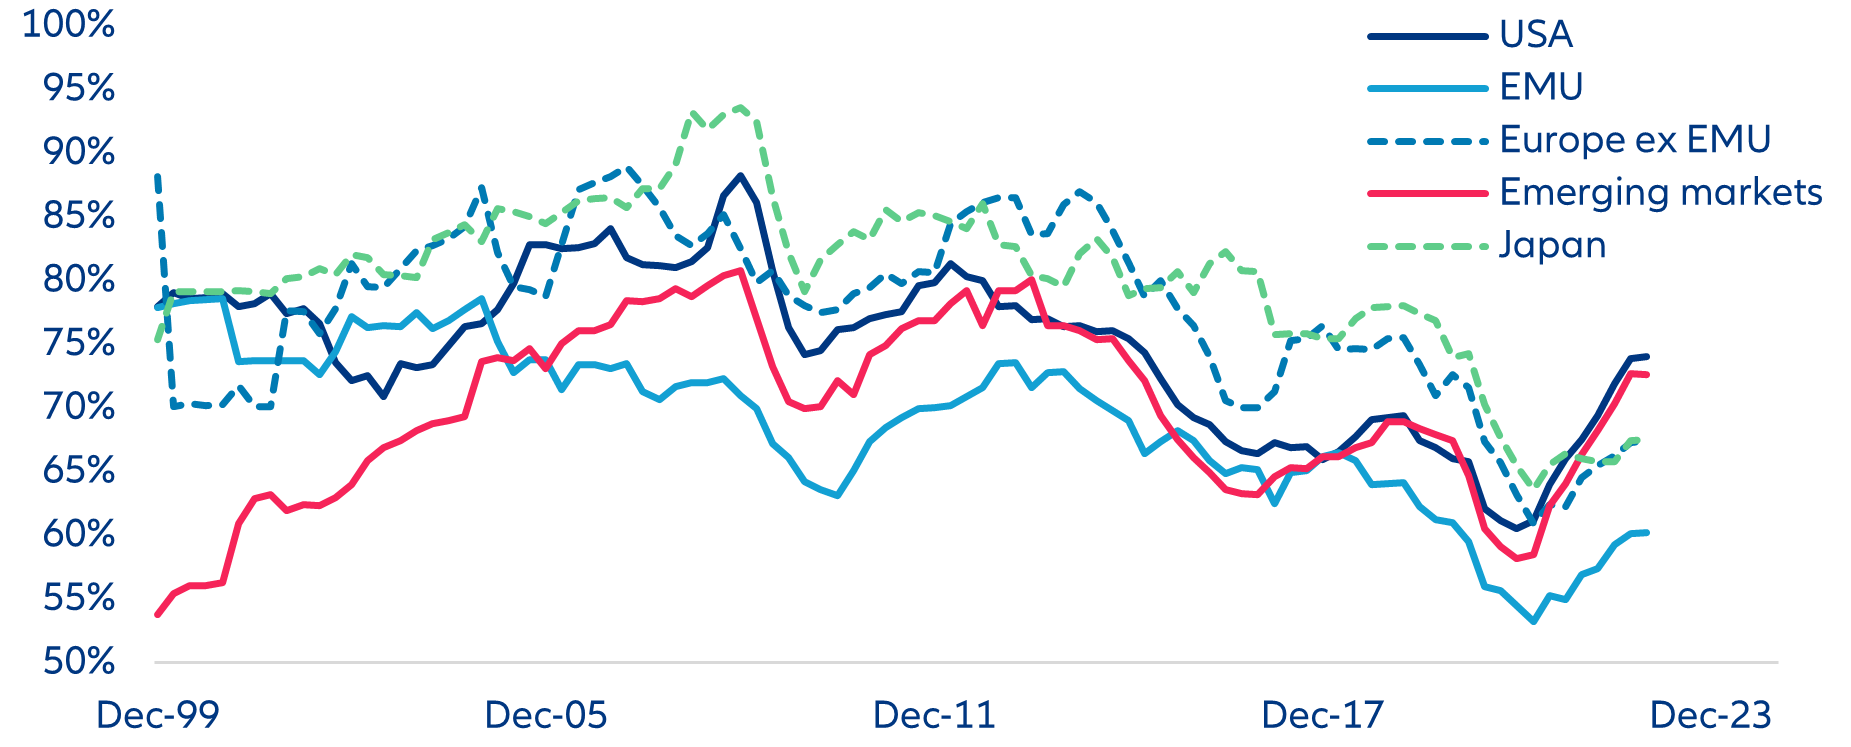
Sources: Refinitiv, Allianz Research
Figure 4 – Equity leverage (D/E)
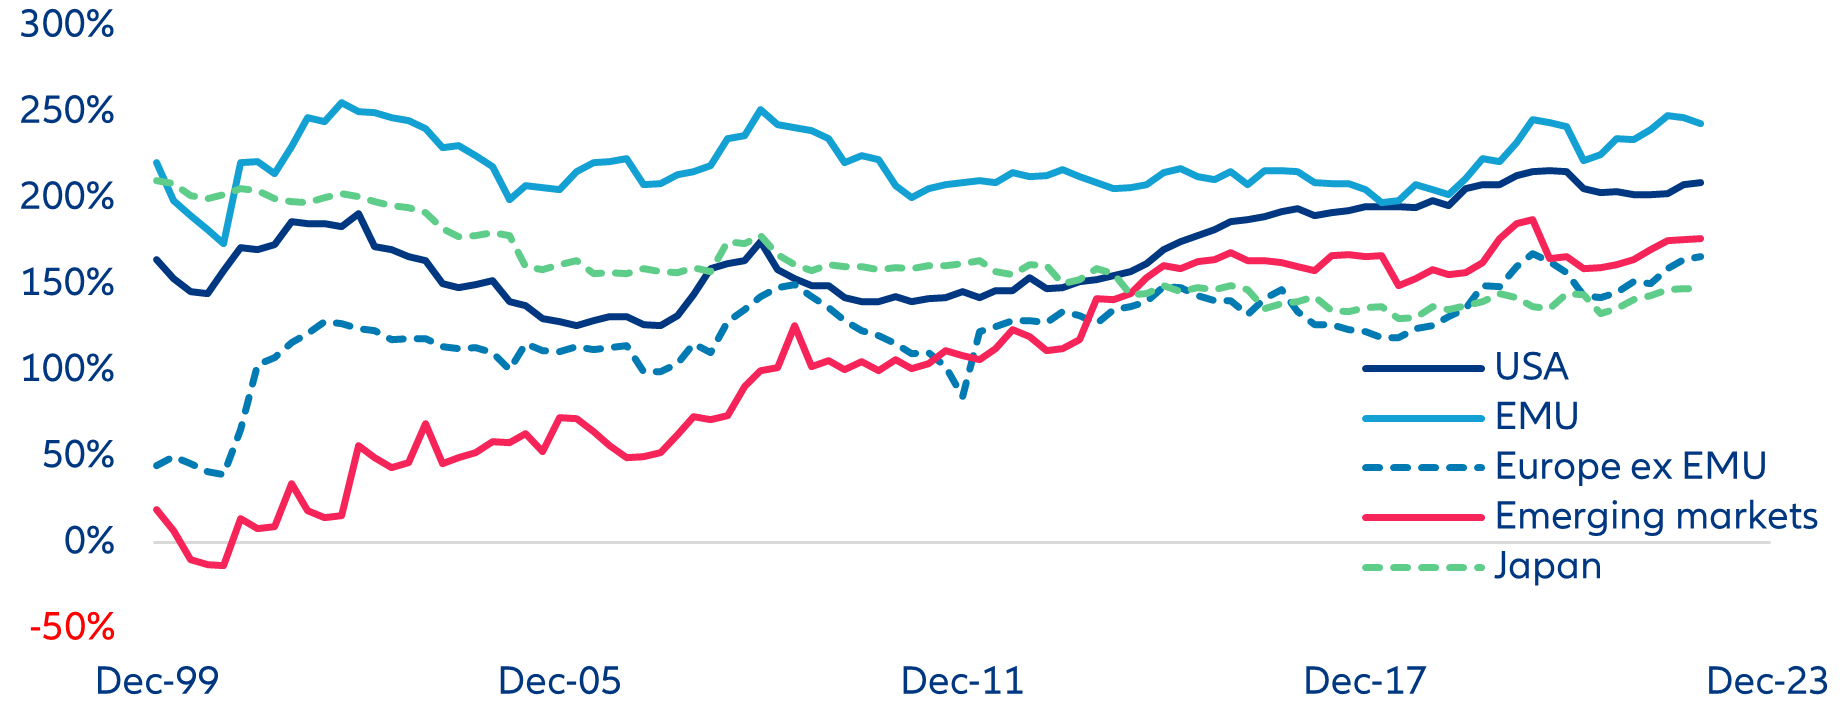
Sources: Refinitiv, Allianz Research
Since 2007, except for Japan, increasing leverage has been the key driver of returns on equity, especially in the US. Except for the US, profitability (RoC and its spread over the cost of debt) has declined. Taxation has had a second order and opposite impact (Figure 5 and 6, below and opposite). Since 2007, the RoC has declined in all countries or regions, driven by a general decline in the sales-to-assets ratio (Figure 6).
Figure 5 – Drivers of change in RoE from 2007 to date

Figure 6 – Drivers of change in RoC from 2007 to date
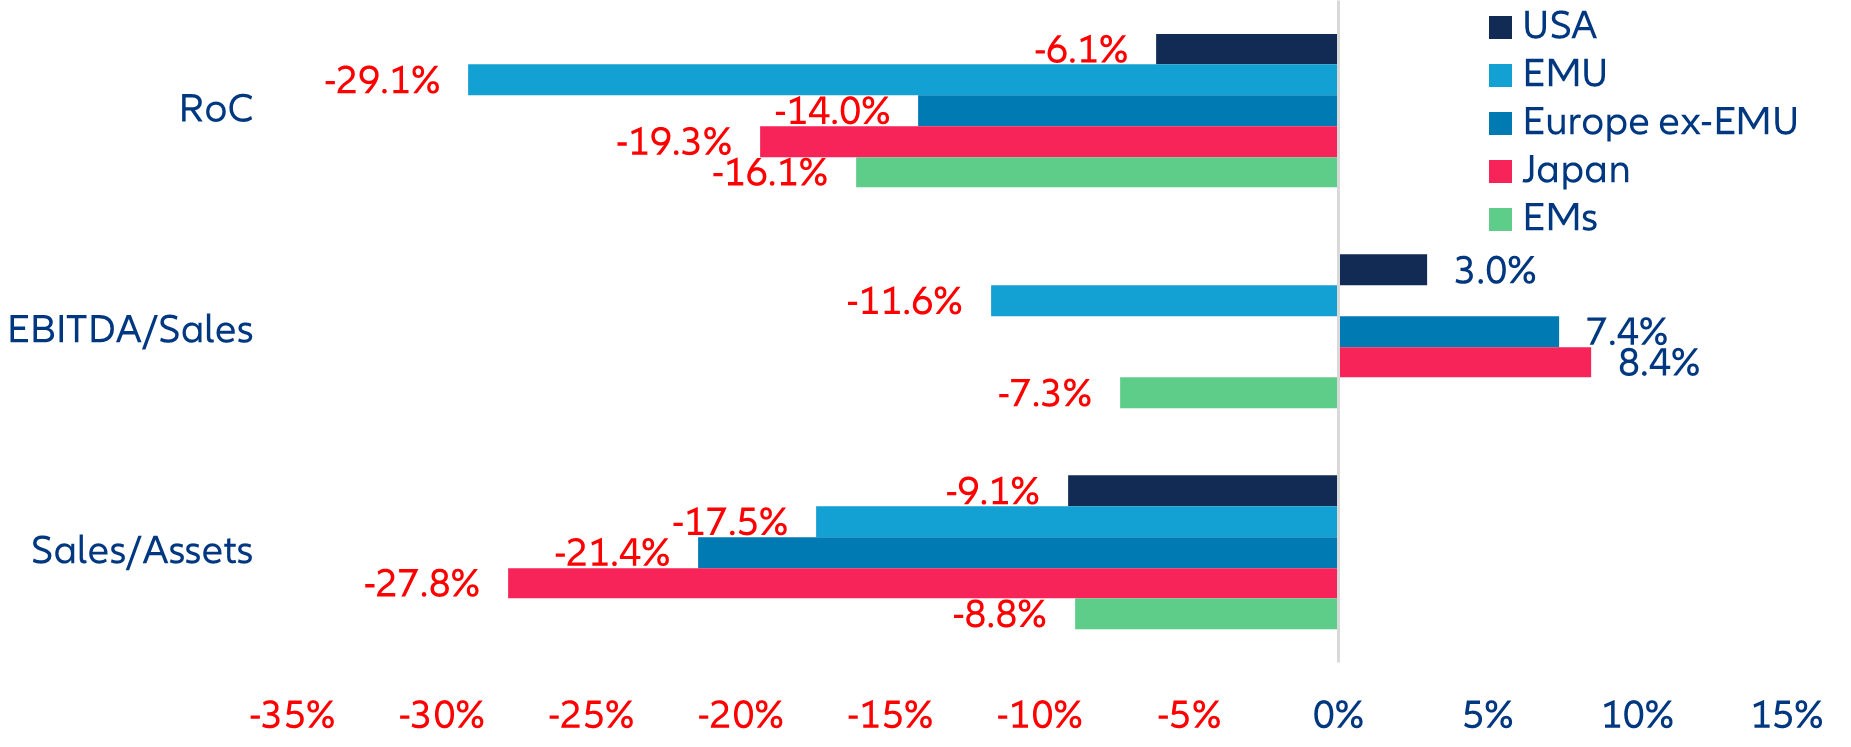
Sources for figure 5 and 6: Refinitiv, Allianz Research
Leverage increases when debt is rising, when equity is falling or when both things happen at the same time. If a company decides to buy back its shares (as many firms did in 2022), its equity is reduced and therefore its RoE is inflated. This was particularly seen in the energy sector, which on top of recording bumper profits also recorded the most share buybacks in 2022, on the back of the enormous amounts of free cash flow generated (Figure 7). As a result, it was one of the sectors with the highest RoE.
Figure 7 – Share buybacks by global sectors: 2007 to 2022 average
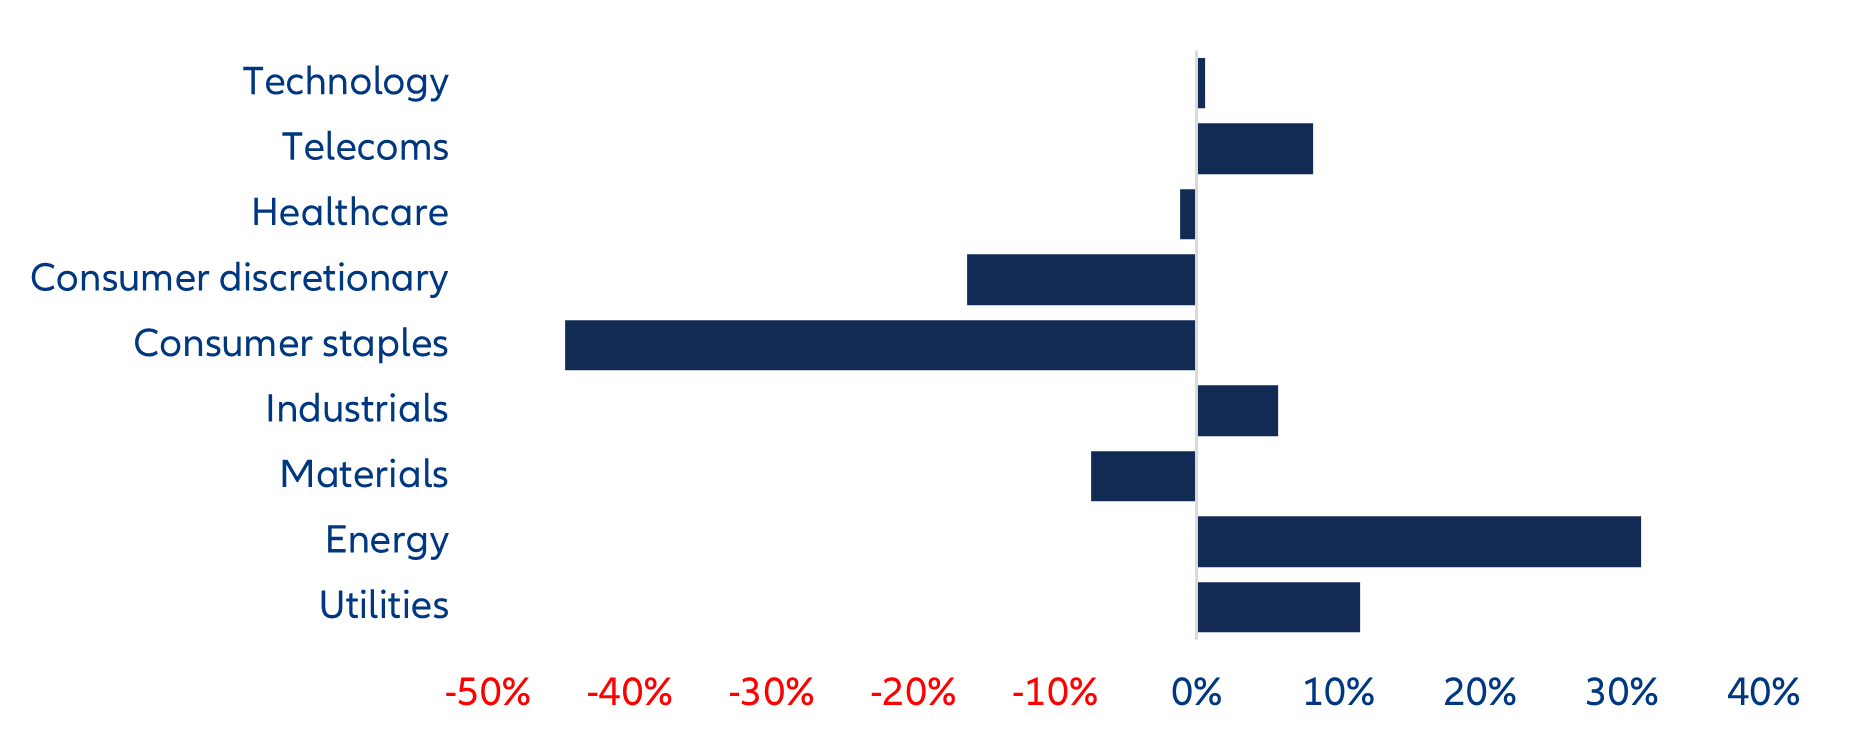
Sources: Refinitiv, Allianz Research
Sector specialization across regions affects capital intensity and funding needs
When comparing the RoE and its drivers across regions or countries, one should bear in mind that the weights of the constituents of the non-financial sector vary greatly across them (Figure 8, opposite):
- The Japanese market is the most concentrated in our sample, with a concentration index of 0.1606. Its two largest constituents are consumer discretionary (27.7%) and industrials (27.4%); technology comes third with 12.3%.
- In Europe outside the Eurozone and the US, the degree of concentration is about the same (0.1223 and 0.1163), but the dominant sectors are not the same. In the US, technology is in the lead (28%) followed by healthcare (16.6%) and consumer discretionary (16.4%), while in Europe outside the Eurozone healthcare leads (26.5%), followed by industrials (19.7%) and consumer staples (18.2%).
- In the Eurozone and EMs, the degree of concentration is again about the same (0.0821 and 0.0772), but the dominant sectors are again not the same. In the EMU, consumer discretionary leads (27.4%), followed by industrials (19.6%) and technology (11.8%), while in EMs energy leads (28.7%), followed by technology (13%) and consumer discretionary (12.6%).
Figure 8 – Sector weights by region or country
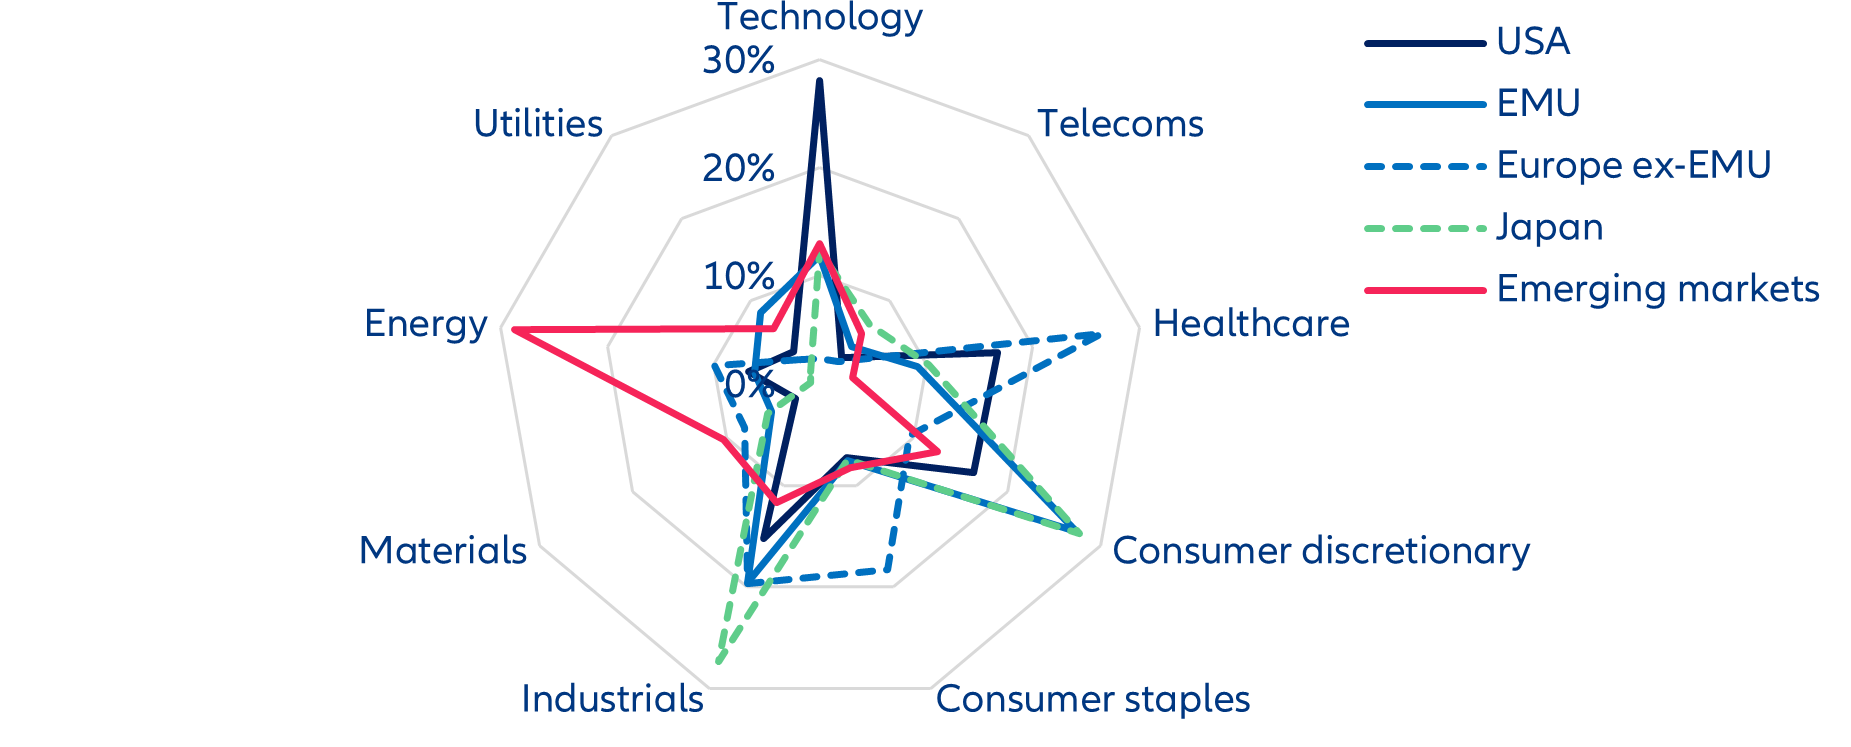
Sources: Refinitiv, Allianz Research
Identifying capital intensity: Utilities, energy, materials and consumer discretionary are the sectors with the highest levels of capital expenditures (measured by the ratio of capex-to-EBITDA). In contrast, the least capital-intensive industries are healthcare, consumer staples and technology (Figure 9).
Because industrial and discretionary activities need significant funds (equity) to finance their investment needs, the equity for industrial companies tends to be higher than the equity of services companies, consulting firms for example. As a result, their RoE is generally lower. In this context, what a company does has an impact on its return on equity. In Figure 10, we can see that the regions with the highest RoE in recent years are the US, followed by EMs and Europe outside the Eurozone, where the technology and consumer discretionary sectors dominate. Conversely, the regions with the lowest RoE levels are Japan and the Eurozone, which rely more on the industrials sector.
Figure 9 – Capex-to-EBITDA ratio by global sectors: average 2007-2022
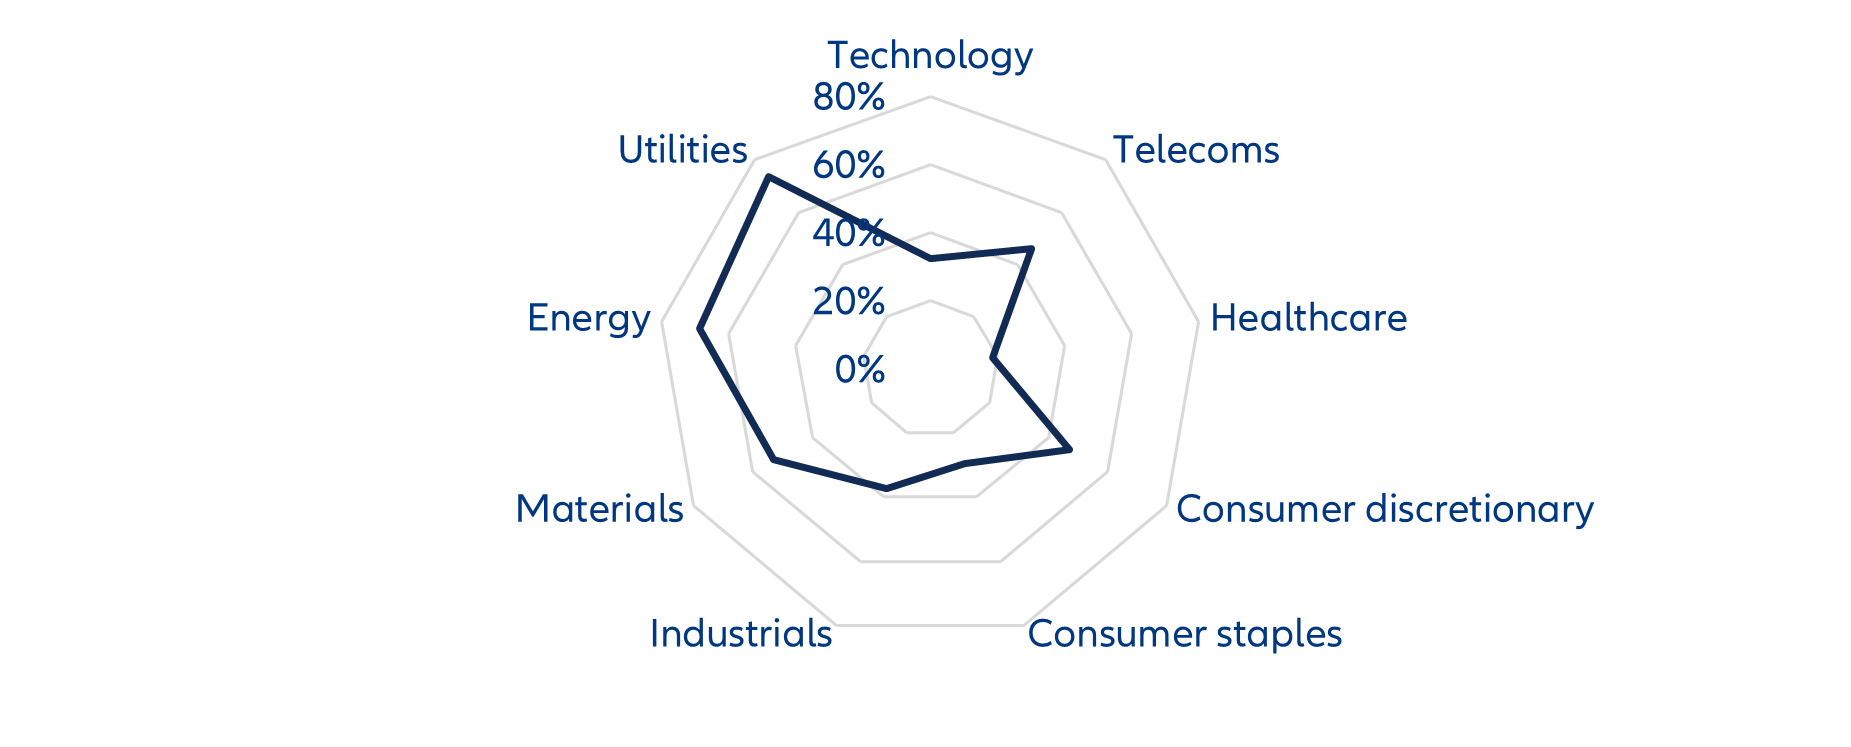
Sources: Refinitiv, Allianz Research
Figure 10 – After-tax RoE
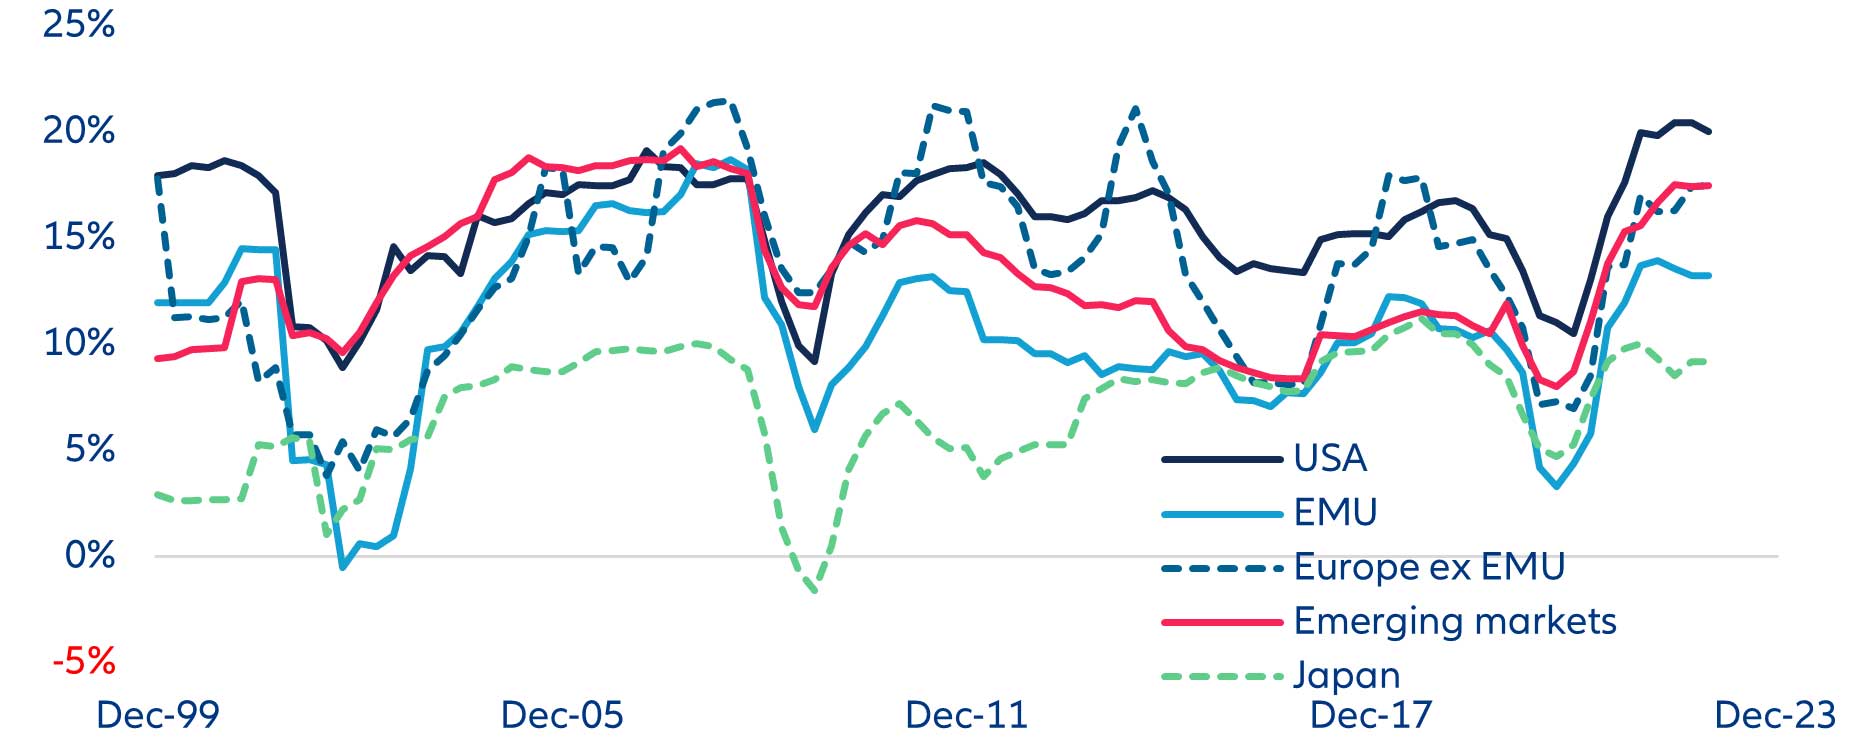
Sources: Refinitiv, Allianz Research
The US ranks first in terms of RoE because of its high concentration in the technology services sector (almost 30% of its stock market), which has the lowest capex and financing needs. But from a cyclical point of view, this also exposes the US market as a whole to the performance of the tech industry, which has disappointed investors in the past quarters. Already high, leverage is unlikely to increase further in the context of tighter monetary and credit conditions. Higher taxation rates as well as stricter regulation are also likely developments.
The Eurozone has been backed by considerable government support since 2020. As the region has the most ambitious decarbonization targets on the planet, we can expect further government cooperation with corporates in order to reach these challenging objectives. However, the Eurozone is very much exposed to consumer discretionary and industrials, two quite cyclical sectors. In parallel, its leverage is at a record high and is therefore unlikely to increase further in the current monetary climate. There is also little room left for a further fall in the taxation rate.
In Europe outside the Eurozone, the market has benefited from its high exposure to healthcare,
a sector that enjoys high pricing power. Beyond this, the market’s large exposure to consumer staples counterbalances its also large exposure to capital intensive industrials. This region is also the one with the highest EBITDA-margin improvements in the past two years, proving resilience despite its proximity to the Ukrainian conflict. But too much of a good thing – i.e. healthcare – entails some challenges. The sector is highly controlled and supervised, and branded-drugs producers are facing intensifying competition from generic drug makers, which are gaining territory in a context of global inflationary pressures.
Despite enjoying the lowest cost of debt, the Japanese market exhibits the lowest leverage. If deleveraging continues in Japan, it is probably because the memory of the damages caused by zaitech in the 1990s is still vivid. Even more than the Eurozone, the Japanese market is very much exposed to two quite cyclical sectors: consumer discretionary and industrials. In contrast, it has a negligible exposure to energy. The effective taxation rate is high by historical standards. Desirable as it may be to cut it, the situation of Japanese public finances probably forbids it.
In EMs, the equity market seems to be walking on two legs: by and large, energy first; second, an upstream position in the global supply chains of three sectors: consumer discretionary, industrials and technology. Therefore, decarbonization and deglobalization are the two key challenges for this market, with a potential negative impact on its return on capital employed. Increasing leverage while cutting the cost of debt is the joker emerging markets should strive to bring out, monetary credibility permitting.
In conclusion, when assessing the outlook for equity returns across markets, the fundamental factors that influence the RoE – the RoC, its spread over the cost of debt, the equity leverage, the effective taxation rate and sector specialization – do matter. The respective impacts of these factors vary across markets, have varied in the past and will continue to do so. Depending on which drivers of RoE have played a dominant role in a given market to the present day, this market is more or less acutely exposed to cyclical or structural challenges. In the context of a tightening of credit conditions and a potential recession, US and Eurozone markets may now experience the dark side of leverage, which also increases the volatility of the RoE. As a consensus emerges amongst OECD members to stop the race to the bottom with respect to taxation rates, what has been a tailwind, especially in the US and the Eurozone, may now become a headwind. In EMs, the large exposure to energy is both a cyclical challenge, if the global economy enters a recession, and a structural one,
if global warming is to be contained.
Cyclical as well as structural forces are likely to exert a downward pressure on the RoC, while corporate finance is left with few unused tools to offset the resulting downward pressure on
the RoE.