- Some important segments of the US equity market (the NASDAQ, the NASDAQ 100, the S&P 500 home builders index) were most likely in a bubble mode in 2021; they have not yet completed a typical post-bubble correction, offering more downside than upside.
- In contrast, equity markets in other advanced economies as well as in emerging markets were not in bubble territory; they now offer more upside than downside.
- To reach such conclusions, we do not rely on valuation metrics; instead, we use an original methodology that focuses on how past market movements influence investors’ psychology in a context of uncertainty.
Capital Markets
The anatomy of financial bubbles, crashes & where we stand today
Is the current market correction a bona fide bubble-bursting episode? And if so, can it get worse?
Impressive as they may be, the 20-30% corrections experienced in the first half of 2022, the worst first-half drop in more than 50 years, have not come in from the cold. They have instead followed a period of rapid price appreciation; their starting points were elevated ones. Hence, two questions are to be answered: firstly, were the starting points of such corrections so high that markets had become bubbles? Secondly, if markets were in a bubble mode, have they deflated as much as they typically do when a bubble bursts? As always, understanding where we are coming from might help to figure out where we are heading to.
Our answer – namely, yes, some key market segments, mainly in the US, were in a bubble mode, but no, it is not yet time to increase exposure to risky assets – may not be original, but the quantitative method we use to reach it is. As we live in a world of uncertainty (“unknown unknowns”) rather than in a world of risk (“known unknowns”), we assume that fundamental valuation is an elusive notion about which investors cannot form rational expectations. We focus instead on how past market movements influence investors’ psychology. In our framework, a market becomes a bubble when market participants, looking at the sequence of past returns, perceive it to rise at an elevated pace. To measure such a pace, we use a weighted average of past returns, the weighting factors of which possess a unique property: they are time-varying (or context-dependent). We label this metric the perceived return. To characterize a bubble, we set a threshold of 15% a year for the perceived return.
The bubble bursts when the market reaches a level that becomes a long-lasting high-water mark (of at least 260 trading days). By combining these two criteria – a perceived return in excess of 15% a year when the bubble bursts and a long-lasting high-water mark – and applying them to 44 different markets (equity markets: 22 in advanced economies, 12 in emerging economies; commodities: six; precious metals: three; crypto-currencies: one) in the post-WWII period, we identify almost 100 bubbles. The next and final step of our investigation is to assess whether the paths followed by the perceived returns before as well as after these 100 high-water marks exhibit some common patterns or characteristics. We find they do. We use such patterns and characteristics to assess the current situation in capital markets. According to our methodology, some important segments of the US equity market (the NASDAQ, the NASDAQ 100, the S&P 500 home builders index) were most likely in a bubble mode in 2021, and they have not yet completed a typical post-bubble correction. In contrast, equity markets in other advanced economies as well as in emerging markets were not in a bubble mode.
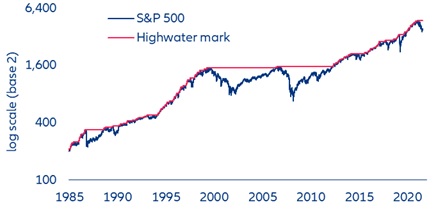
With the benefit of hindsight, it is easy to spot when a bubble has burst: A bubble bursts when it reaches a long-lasting high-water mark. This provides us with is our first bubble criterion. When a market is in a rising trend, it frequently reaches new highs and the pattern is one of higher highs (both the blue line and the red one are rising). From time to time, a new high is not exceeded for a long time because it is followed by a protracted price decline (the blue line falls but the red line becomes horizontal because there is no new high coming). Then, if the red line remains horizontal for more than 260 trading days, the last new high becomes what we call a long-standing high-water mark.
High-water marks for the S&P 500 1984 to date
