Boom in financial assets continues


Today, Allianz unveiled the sixth edition of its "Global Wealth Report", which puts the asset and debt situation of private households in more than 50 countries under the microscope. Based on the findings of the report, three first-time milestones in financial asset development were passed in 2014: The global net financial assets of private households surpassed the 100-trillion-euro mark, China’s private financial assets exceeded those of Japan, and the number of people falling into the wealth middle class in global terms breached the 1 billion mark. In detail:


Global gross financial assets of private households grew by 7.1 percent in 2014; thus the robust growth witnessed in previous years continued, albeit at a slightly slower pace. Increasingly, growth is driven by households moving up a gear with their savings efforts; in Asia and America, stock markets continued to be a tailwind This brought total global gross financial assets up to a new record level of EUR 136 trillion – higher than the value of all of the world's listed companies and all sovereign debt. “Many observers will interpret these figures as evidence for the so-called savings glut”, said Michael Heise, Chief Economist at Allianz. “But this is the wrong perspective. Against the backdrop of low interest rates, too many households are still not saving enough for old age. Policymakers should not try to restrict savings but find new ways and incentives to promote capital demand. There is no lack of investment opportunities because the challenges that lie ahead are huge: climate change, poverty and migration, digital revolution, outdated infrastructure – to name but a few.”


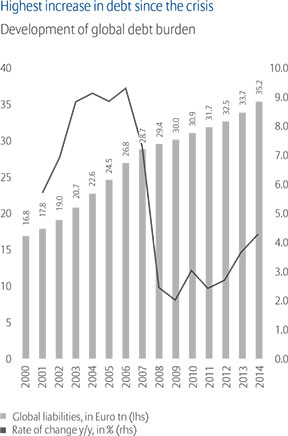
Slower than financial assets, global liabilities of private households climbed by 4.3 percent to total EUR 35 trillion last year, bringing global debt growth up to the highest level seen since the outbreak of the financial crisis. If we subtract debt from the gross financial assets, we arrive at a new record figure for net financial assets of over EUR 100 trillion at the close of 2014, an increase of 8.1 percent on a year earlier.


As in previous years, regional growth in financial assets differs widely. The unrivalled growth champion remains Asia (ex. Japan), where net financial assets grew by 18.2 percent in 2014. The main driving force behind this trend was the sharp (and sometimes not sustainable) increase in securities assets, particularly in China. In the world's other two emerging regions, Latin America and eastern Europe, on the other hand, developments were much more subdued: financial assets increased by 4.2 percent (Latin America) and 8.6 percent (eastern Europe) respectively. Positively, at least from a European perspective: in 2014, the eurozone notched up higher growth than North America for the first time since the financial crisis. The strong growth of 6.2 percent (compared with 5.3 percent in North America) was thanks largely to strict “debt discipline”: In many countries, the cutback of private debt continued in 2014 as well.
 

Because of Asia, weightings continued to shift
 

Permanent high growth in Asia has also left its mark on the world asset map, where weightings continued to shift. The region Asia (ex Japan) accounted in 2014 for a good 16 percent of the world's financial assets (gross as well as net). This figure is up by 1.4 percentage points on 2013 and means that the proportion of assets held by this region has more than trebled since 2000. Last year also saw a major landmark being passed as part of this catch-up process: China's total gross financial assets exceeded those of Japan for the first time at the end of 2014. “Recent growth in financial assets in Asia, in particular in China, was really very positive”, commented Heise. “Against this backdrop, a slowdown in growth – as we are currently witnessing – is not worrying at all. China’s catch-up process is by no means over, China today is a different, much richer country than five or ten years ago. The positive impact of China’s rise for the economy and financial markets worldwide is still tremendous.”

Allianz Global Wealth Report: Boom in financial assets continues

The increasing weight of Asia can also be seen from a different perspective. Last year, the number of people falling into the wealth middle class in global terms surpassed the 1 billion mark for the first time.[1] Since 2000, almost 600 million people from the "low wealth" category have been promoted to the wealth middle class. All in all, membership of this group has trebled since the turn of the millennium. This momentum is, however, concentrated primarily in only one region, or rather indeed in only one country: China. Around two-thirds of the global wealth middle class are now recruited from Asia – and 85 percent of them hail from China. This means that the Asian population falling into the middle class bracket has increased almost tenfold since the start of the millennium. “This development highlights the inclusive nature of asset growth in a global comparison: more and more people are managing to participate in global prosperity”, commented Heise.


In Germany, gross financial assets grew solidly last year, by 4.2 percent, but again more slowly than the European average. Against the backdrop of the highest saving rate in the region, this development is rather disappointing; it mirrors the still very cautious, rather risk-averse approach of German households when it comes to making investment decisions. This is also reflected in the ranking of the 20 richest countries (per capita financial assets, see table): Although in net terms Germany was able to maintain its 18th rank (EUR 44,770) in gross terms, it has dropped four rungs to 19th (EUR 64,510) since 2000.
 
German households: risk-averse approach concerning investment decisions
 

This sees Germany joining other eurozone members which also fell back markedly: Belgium slipped by four, France by five and Italy even by eleven rungs. A similarly big drop was suffered only by Japan, but this was also triggered by a weaker yen. The big winners are – besides Australia and Taiwan – the Scandinavian countries: Sweden moved up seven, Norway six and Denmark four places. Among the euro members, only the Netherlands improved its ranking. No change at the top: Switzerland and the USA have topped the list of the richest countries since 2000. “Such rankings should be taken with a pinch of salt”, explained Heise. “However, the long-term movements are quite significant, the message is clear: The euro crisis wreaked real damage on the accumulation of financial assets, with only two euro members still among the Top 10 of our list.” 
 

The direct impact of the ECB’s low interest rate policy on income in the form of lost interest income and reduced interest payments on loans differs from country to country. All in all, eurozone households benefited handsomely: for the six years from 2010 to 2015, the "interest rate gains" add up to EUR 130 billion (1.4 percent of GDP) or around EUR 400 per capita. The biggest winners are the southern Europeans such as Portugal, Greece or Spain: In all these countries, gains exceeded EUR 1,200 per capita, in Portugal and Greece these gains equal 12 percent of GDP, in Spain 6 percent. On the other hand, Germany (with Belgium and Slovakia) is among the losers, "interest rate losses" add up to just under EUR 30 billion (1.1 percent of GDP) or around EUR 367 per capita. However, these calculations do not take monetary policy effects on other assets classes into account.

The US represents more the exception than the rule among market economies


Nonetheless, taking monetary policy into account or not, wealth distribution differs widely among countries. In order to show how wealth is distributed at the national level, we have calculated a Gini coefficient for each country for the first time in this report, namely for the past (period around 2000) and for the present day. Looking at all of the countries in our analysis, the number of countries in which the Gini coefficient of wealth distribution has "improved" over time (i.e. showing more equal distribution) is roughly on a par with the number of countries in which it has deteriorated. However, the world’s developed countries paint a different picture, most of these countries have seen a (sometimes considerable) increase in the inequality of distribution in recent years. This holds true for the US in particular: Here, the increase in inequality is more pronounced than in any other country during the period analyzed and the USA has the highest Gini coefficient (80.6). The value for Germany is 73.3 – considerably above the average for developed countries (64.6). Besides the USA, only Sweden, the UK and Austria have a higher Gini coefficient. On the other hand, there was almost no change in wealth distribution over the last decade in Germany. “At first glance, wealth inequality seems to be high in Germany; however, the high Gini coefficient reflects first and foremost the still protracted split between East and West”, said Heise. “The situation in the US, on the other hand, is clearly worrying. However, our calculations indicate that developments have not been quite as dramatic in the other countries. As usual, the US represents more the exception than the rule among market economies. This is often lost in our debates, because of the dominance of Anglo-Saxon economists, and the situation in the US is seen as synonymous with the rest of the world. Fortunately, this is not the case.”


[1] As in previous years, the "Allianz Global Wealth Report" splits asset owners into three global wealth classes. The global wealth middle class encompasses all individuals with net assets of between EUR 6,100 and EUR 36,700.

Highest increase in debt since the crisis

Top 20 in 2014 by…
 

...net per capita financial assets

in EUR y-o-y in % rank 2000
#1 Switzerland 157,450 5.7 1
#2 USA 138,710 4.2 2
#3 UK 86,230 16.9 4
#4 Belgium 84,770 3.1 3
#5 Sweden 82,930 16.9 12
#6 Netherlands 78,060 21.3 8
#7 Canada 76,510 9.7 7
#8 Japan 73,550 3.5 5
#9 Singapore 73,330 4.9 14
#10 Taiwan 72,640 7.6 17
#11 Denmark 72,310 16.3 11
#12 New Zealand 65,650 3.6 10
#13 Israel 58,910 11.4 13
#14 Australia 53,800 8.2 19
#15 France 50,770 3.1 9
#16 Italy 49,420 3.4 6
#17 Austria 48,420 2.9 16
#18 Germany 44,770 5.2 18
#19 Ireland 43,030 20.7 15
#20 Finland 25,060 1.4 21

Top 20 in 2014 by…
 

...gross per capita financial assets

in EUR y-o-y in % rank 200
#1 Switzerland 238,310 4.6 1
#2 USA 175,010 3.7 2
#3 Denmark 135,830 8.1 7
#4 Netherlands 126,700 12.0 6
#5 UK 120,370 12.4 4
#6 Sweden 120,240 12.8 13
#7 Canada 114,680 7.7 8
#8 Australia 113,660 6.9 14
#9 Belgium 107,020 3.5 5
#10 Singapore 106,620 4.4 10
#11 Japan 94,980 3.3 3
#12 Taiwan 88,160 6.9 18
#13 New Zealand 87,320 3.6 16
#14 Norway 86,110 6.5 20
#15 Ireland 78,960 6.6 12
#16 France 72,370 2.4 11
#17 Israel 70,660 10.2 19
#18 Austria 68,050 2.2 17
#19 Germany 64,510 3.8 15
#20 Italy 64,420 2.5 9

As with all content published on this site, these statements are subject to our Forward Looking Statement disclaimer:


Dr. Lorenz Weimann
Allianz SE
Phone +49 69 24431-3737
Send email

Mar 12, 2024

Sustainability will be treated like finance and we need all our employees to work on it

read more

Mar 06, 2024

Allianz SE extends contracts of Board Members Sirma Boshnakova and Günther Thallinger

read more

Mar 01, 2024

Allianz completes the acquisition of Tua Assicurazioni in Italy

read more